Unit costs – what do they mean?

unit costs

Both the G8 Social Impact Investment Taskforce report and Impact Investing Australia’s report to the G8 have called for publication of unit costs of government services, in order to encourage social innovation and social investment. The assumption behind this seems to be that:

  1. If people know the cost of delivering something, then
  2. They might develop a preventative social program that allows these costs to be avoided, which
  3. Saves the government money, and
  4. Delivers better social outcomes for the population.

Well this may be true for things like employment services, where the government saves cash by not paying unemployment benefits. But you might not get a lot of enthusiasm from some other parts of government. And that’s because a reduction in demand for government services doesn’t necessarily mean that government saves money. In order for this to happen, costs must be able to be recouped i.e. they must be marginal, reflecting the additional cost to the system of more people requiring more services. Marginal costs represent what can be saved if this government service isn’t required. So it all depends on how government spending currently occurs.

Let’s take a look at types of unit costs and how they are calculated. And then see what this means using the reoffending unit cost examples from the NSW Government’s Office of Social Impact Investment:

Unit cost How is it calculated NSW example  What does it mean? What’s it useful for?
Average operating cost Divide entire budget, (including the cost of things like the head of the department and their staff) by service units e.g. total nights spent in custody in one year It costs Corrective Services NSW $189 per day to keep an inmate in custody. Savings may result in response to reduced demand if a prison or wing of a prison closes, but only if staff are sacked and the prison is not maintained. Useful for governments to benchmark their costs against other governments or identify trends in their expenditure over time.
Cost of time and other items Work out how much time is spent on something and the salaries of the people spending that time. Add in any incidentals like photocopying, petrol, travel. It costs NSW Police $2,696 to finalise an offending event in court. This represents time that could be spent on other tasks- If the number of crimes drops, Police are more likely to reallocate their time, than be sacked. Time, rather than money, is saved. Useful for governments to analyse ways to better allocate human resources.
Capital expenditure Look at budget for new buildings in response to increasing demand. This was not a cost given by NSW Government, but new prisons can cost several hundred million. If demand can be reduced by a certain proportion and maintained for a certain period of time, a new prison may be avoided and the amount budgeted for it maybe saved. Useful for looking at long-term government budget allocations and thinking about the best ways to spend a given amount of money.
Marginal cost (sometimes referred to as cashable savings) The cost of things purchased specifically for one more unit of service  i.e. new trainers, toothbrush, appointments with psychologists, water for washing clothes, food for one more person. It costs Corrective Services NSW $19 per day for every additional inmate in custody Every time a unit of service is avoided, the government can avoid spending this much money. Useful for people outside government to understand their potential impact on government expenditure.

If we assumed that cash recovered from NSW marginal costs were used to fund preventative services, we would:

  • take the $19 per day marginal cost
  • multiply it by the 49% of unsupervised parolees that reoffend within 12 months[1]
  • multiply it by the average 1.8 proven offences they commit in within 12 months[2]
  • multiply it by the 31% of those proven offences that are sentenced to prison[3]
  • and multiply it by the 8 out of 12 months we expect these people to spend in prison from those sentencing (average sentence is 486 days[4] and average time of entry during 12 months post-release is around four months after release[5]).

Then we’d have $3.48 per person per day to spend on our services over the first 12 months. Not a lot.

This doesn’t mean that it’s not worth spending money on preventative services for people who are released from prison. It just means that we need to realise that this isn’t a ‘no brainer’ for government and that it’s a serious spending decision that has to be weighed up against other uses for the cash. It’s certainly not the hugely misleading [6] calculation put forward in the G8 Social Impact Investment Taskforce report:

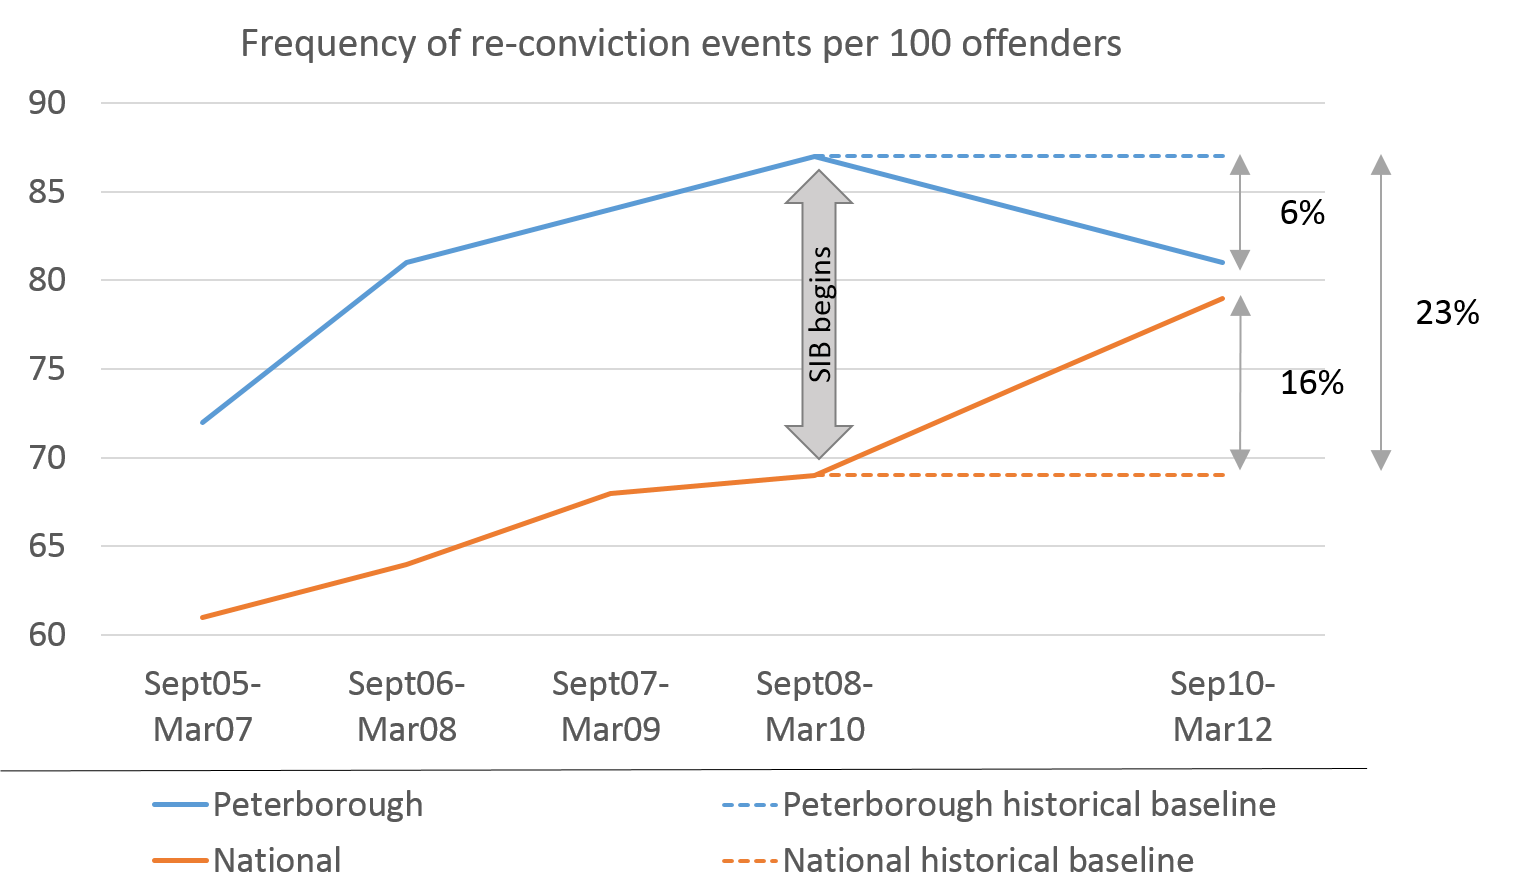
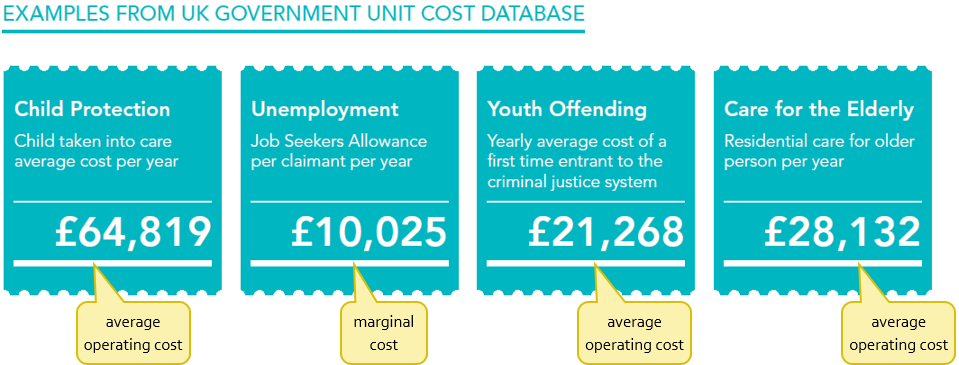
“Say, for example, that a £10 million, five-year SIB for reducing recidivism delivers an 8% financial return and significant social impact by succeeding in rehabilitating 1,000 youth offenders, each of whom would have cost the UK government £21,268 a year. Using the Unit Cost Database gives a value for the social outcome in just the first year of £21 million, and an associated social return per annum of about 15% (internal rate of return) for the SIB” (p.16).

In order for unit costs to be useful, we need to be informative and realistic about what they represent. Marginal costs will reduce as demand falls. But people quoting average operating costs back to government as if they represent savings? Not so helpful.

[1] http://www.dpc.nsw.gov.au/__data/assets/pdf_file/0003/168339/Statement_of_Opportunities_2015_WEB.pdf p8

[2] http://www.dpc.nsw.gov.au/__data/assets/pdf_file/0003/168339/Statement_of_Opportunities_2015_WEB.pdf p8

[3] http://www.dpc.nsw.gov.au/__data/assets/pdf_file/0003/168339/Statement_of_Opportunities_2015_WEB.pdf p8

[4] http://www.bocsar.nsw.gov.au/agdbasev7wr/_assets/bocsar/m716854l11/nswcustodystatisticsdec2014.pdf p22

[5] http://www.dpc.nsw.gov.au/__data/assets/pdf_file/0006/168873/Market_Sounding_-_Reducing_reoffending_and_return_to_custody.pdf p12

[6] Six fallacies of this calculation can be read here http://www.themandarin.com.au/5274-will-publishing-unit-costs-lead-social-investment/

Evidence-based justice – or NOT!

It’s hard to generate good evidence on which to base policy and programs. It’s even harder when that evidence exists, is publicly available and blatantly ignored.

Let’s talk about generating evidence first…

Sometimes when we talk about comparing a group receiving services to a group not receiving services, it is argued that it is unethical to deny anyone a service (this always comes up when planning social impact bonds and other pay for success programs). There is an underlying assumption in this argument that all services are beneficial to their recipients. Results from the Justice Data Lab in the UK show that services are not always beneficial, as some programs that intended to reduce reoffending actually increased reoffending.

Justice Data Lab Oct results

The Justice Data Lab was launched on a trial basis in April 2013. For organisations delivering services to reduce reoffending, it provided the first opportunity to have an effect size calculated against a matched national comparison group, for no financial cost. A key condition of the Justice Data Lab was that the Ministry of Justice would publish all results.

For more information on how the Lab works, see the brief summary I wrote last year.

Critics of the Justice Data Lab point out that organisations are able to choose which names they submit, so are able to bias the results. Despite this, not all results have been positive.

Up to October 2014, 93 programs have applied. Only 30 of these had statistically significant results. Of these, 25 were shown to reduce reoffending and five increased reoffending.

Justice Data Lab Oct results 2

[Technical note: Non-statistically significant results could be due to a number of features in combination, including small effect size (difference between those receiving the service and similar ex-offenders not receiving the service), small sample size (how many people were in the program) and low matching rate. The Justice Data Lab requires that at least 60 people’s names be submitted for matching with similar ex-offenders, but is not always able to match them all. If only 30 offenders were able to be matched, the program would have to have an effect size of at least 15 percentage points in order for the result to be statistically significant with 95% confidence. That is very high – only one of the programs so far has produced a difference of greater than 15 percentage points. (A confidence level of 95% means that if the program were repeated 100 times, at least 95 times the observed effect would be due to the program and the remaining times the observed effect would occur by chance.)]

The UK is currently undergoing a huge policy reform, Transforming Rehabilitation. What role the Justice Data Lab and its results will play in this process is unknown. Sometimes the hardest part of the evidence cycle is making decisions that reflect the evidence.

Disney’s anti-evidence programmingBeyond Scared Straight

Perhaps the most notorious of programs that consistently increases reoffending is Scared Straight. Scared Straight involves taking young people into prisons, where they speak to incarcerated offenders and ‘experience’ being locked up. The idea is that they’re so shocked by what they see they will never offend themselves and risk a life behind bars. Unfortunately, for the young people participating in these programs, the incidence of prison increases.

Scared Straight programs spread across the US after a documentary of the same name won an Academy Award in 1979. The effect of many of these programs was not evaluated, but there were two studies published only a few years later, in 1982 and 1983, showing that out of seven evaluations, not once did the program reduce reoffending, and that overall the program increased reoffending. These analyses have been repeated several times, but the results remain the same (Petrosino (2013) Scared Straight Update).

Scared Straight

Despite this evidence being publicly available and fairly well known, in January 2011, the Disney-owned TV channel A&E began to broadcast their new series Beyond Scared Straight. The program follows “at-risk teens” and is “aimed at deterring them from a life of crime”. Despite outcry, public condemnation and petitions, the channel refuses to cancel the series, which is about to enter its eighth season.

The Washington State Institute for Public Policy estimates that each dollar spent on Scared Straight programs incurs costs of $166.88, making it the only juvenile justice program in their list with a negative cost:benefit ratio (see their summary below).

WSIPP Scared Straight

For the young people enticed into the program, their prize is not only a terrifying experience, but a greater likelihood of a stint in one of the unhappiest places on Earth.

Useful references

The Cochrane Collaboration – systematic reviews of evaluations in health.

The Campbell Collaboration – sister of Cochrane for other policy areas e.g. where the Scared Straight update is published.

Test, Learn, Adapt: Developing Public Policy with Randomised Controlled Trials – from the UK Cabinet Office clearly sets out how public programs can use randomised controlled trials to develop evidence-based programs. Rather than ‘denying’ service, the authors encourage randomisation of rollout of a new program, for example, as a cost-neutral way of enabling better data collection and learning.

Creating a ‘Data Lab’ – from NPC, about submitting the proposal that initiated the Justice Data Lab and continuing work to seed similar programs in other service areas.

Transforming Rehabilitation: a summary of evidence on reducing reoffending (second edition) – 2014 – published by the Ministry of Justice

What Works to Reduce Reoffending: A Summary of the Evidence – 2011 – published by the Scottish Government

The Justice Data Lab – an overview

MoJ Data LabWhat is the Justice Data Lab?

The Justice Data Lab allows non-government organisations to compare the reoffending of the participants in their programmes with the reoffending of other similar ex-offenders. It “will allow them to understand their specific impact in reducing re-offending… providing easy access to high-quality re-offending information” (Ministry of Justice, Justice Data Lab User Journey p.10). There is no charge to organisations that use the Justice Data Lab.

The Justice Data Lab is a pilot run by the Ministry of Justice. The pilot began in April 2013. Each month, summaries of results and data are published, including Forest plots of all results so far.

Who might use it?

The Justice Data Lab can be used by “organisations that genuinely work with offenders” (Justice Data Lab User Journey p.11). One request will provide evidence of a programme’s effect on its service users’ reoffending. Several requests could compare services within an organisation or over time to answer more sophisticated questions about what is more effective.

This information could be used by non-government organisation for internal programme improvements, to report impact to stakeholders or to bid for contracts. It was set up at the time the Ministry of Justice’s Transforming Rehabilitation Programme was encouraging bids from voluntary and community sector organisations to deliver services to reduce reoffending.

What are the inputs?

Input data are required to identify the service users from a specific program and match them with a comparison group. Information on at least 60 service users is required and the organisation must have worked with the offender between 2002 and 2010.

Essential:

  • Surname
  • Forename
  • Date of Birth
  • Gender

At least one of the following:

  • Index Date
  • Conviction Date
  • Intervention Start Date [note: feedback from applicants is that this is required]
  • Intervention End Date [note:feedback from applicants is that this is required]

Highly Desirable: PNC ID and/or Prison Number

Optional: User Reference Fields

What are the outputs?

The one year proven re‐offending rate –  defined as the proportion of offenders in a cohort who commit an offence in a one year follow‐up period which received a court conviction, caution, reprimand or warning during the one year follow‐up or in a further six month waiting period. The one year follow‐up period begins when offenders leave custody or start their probation sentence. A fictional example of the output provided by the Ministry of Justice is quoted below:

The analysis assessed the impact of the Granville Literacy Project (GLP) on re‐ offending. The one year proven re‐offending rate for 72 offenders on the GLP was 35%, compared with 41% for a matched control group of similar offenders. The best estimate for the reduction in re‐offending is 6 percentage points, and we can be confident that the reduction in re‐offending is between 2 and 10 percentage points.
What you can say: The evidence indicates that the GLP reduced re‐offending by between 2 and 10 percentage points.

Publication
Applicants should note the following requirement: “an organisation requesting data through the Justice Data Lab must publish the final report, in full, on the organisation’s website within four months of receiving the final report.”

I’d be very interested in the opinions of applicants on this requirement. Is it an issue? Does it create perverse incentives?

What are the implications?

The implications are huge. Prior to the Justice Data Lab it was very difficult for non-government organisations to establish a comparison group against which to measure their effect. Evaluations of effect are expensive and thus prohibitive, particularly for smaller organisations. In addition, the differences in their methods and definitions meant that evidence was more difficult to interpret and compare.

This is exactly the type of evidence that developers of social impact bonds find so difficult to establish and will be essential to constructing social impact bonds to deliver  Transforming Rehabilitation services. It is a measure of outcome, which is desirable, but often more difficult to quantify than input (e.g. how much money went into the programme), activity (e.g. what services were delivered) or output (e.g. how many people completed the programme).

New Philanthropy Capital (NPC) were involved in designing the Justice Data Lab and their Data for Impact Manager, Tracey Gyateng, is specifically thinking about applications to other policy areas.

How is it going?

See my November 2014 post on information coming out of the Justice Data Lab.

Also note the announcement of an Employment Data Lab by NPC and the Department of Work and Pensions.

More information

Information on the Justice Data Lab home page includes links to a series of useful documents:

  • User journey document – information on what the justice data lab is, and how to use its services.
  • Data upload template – use this template to supply data to the justice data lab. Further descriptions of the variables requested are given, and there are key areas which must be filled in on the specific activities of the organisation in relation to offenders.
  • Methodology paper – this document gives details of the specific methodology used by justice data lab to generate the analysis
  • Privacy impact assessment – this is a detailed analysis of how an organisations’ data will be protected at all stages of a request to the justice data lab
  • Example report template – two examples of a standard report, completed for two fictional organisations showing what will be provided.

Criminal justice service providers might also benefit from getting involved in the Improving Your Evidence project, a partnership between Clinks, NPC and Project Oracle. The project will produce resources and support, so follow the link and let them know what would be of most use. The page also links to an introduction to the Justice Data Lab – a useful explanation of the service.

The bulk of this post has been copied directly from the Ministry of Justice documents listed above. It is intended to act as a summary of these documents for quick digestion by potential users of the Justice Data Lab. The author is not affiliated with the Ministry of Justice and does not claim to represent them.

Mapping the needs of a community

Australian update: Community Insight Australia is working to shape and translate the Community Insight tool for Australia. Please get in touch if you share our vision and would like to take the journey with us.


Policy-makers know that social programmes are more effective if they are provided in the areas of greatest need. But, historically, it has been resource intensive to identify either areas of need or the range of needs of a particular community. This task would either involve weeks of combing through the latest data from all reliable sources or painstakingly interviewing a large enough sample to make assumptions about the populations. As a public servant, I’ve spent hours on the computer painting maps of social disadvantage, a new map for each indicator.

This problem is also faced by Housing Associations and other social housing landlords, who provide homes to over 4.5m households across England, and operate in an environment in which accurate data about communities they work within has become increasingly important to policy and delivery decisions. Their ability to access relevant data has been limited by poor quality data systems and a reliance on a limited pool of research analysts to interpret the data that was available.

In response to this, new housing think-do tank HACT and social policy data experts OCSI recently launched Community Insight, a web-based tool which allows non-expert staff at all levels to explore geographically social indicators of need quickly and easily for the first time, using constantly-updated, reliable data.

I was lucky enough to have Matt Leach, from HACT, take me through Community Insight and I couldn’t have been more impressed. The key to the tool is its simplicity.

  1. You choose the geographic area you are interested in on a map of England and Wales.
  2. The tool will give you the demographic and social indicators of the area.

Screenshot of Community Insight showing a selected area, specific houses by housing type, social indicator categories on the left and colours on the map showing the density of the chosen indicator, mental health issues.

Community Insight area screen grab

Features:

  • the social indicators are also presented in comparison to the national average
  • information about a geographical area can be interacted with online or exported in seconds as a detailed report
  • you can drill down by area or statistical collection for more information
  • the statistical collections behind the tool are automatically updated as their sources are updated
  • geographical areas can be defined specifically by a spreadsheet of housing stock or drawn with your finger or a mouse onto a map as a suburb, county or region.

Some of the ways housing providers are using Community Insight could transfer to policy makers and programme designers:

  • comparing between different areas in order to target community investment programmes to areas of greatest ‘need’
  • assessing change over time in different areas, as a starting point for evaluation of programme impact
  • combining with more detailed data from administrative data sets, to develop ‘at-risk models’ to identify areas and properties (and indeed individuals) that might be at risk e.g. of rent arrears

The tool is notable for a number of reasons:

  • it is one of the first large scale commercial approaches to accessing and interpreting open data launched by a UK-based social enterprise in a major public service area
  • it was designed from the bottom up as a tool for practitioners (one of the design principles that drove the team was “democratising data”)
  • it has had instant, mainstream success, with over 60 landlords with a total stock in management of nearly 1m households subscribing to the service within 4 months of its launch
  • it’s incredibly easy to use and the data produced is fit for purpose.

Easy to use

The tool was developed with its users involved at every step of the way. Rather than start with the data sets and try to make them interactive, the development of Community Insight was driven by the needs and intentions of the user. The intended users are housing providers – they can upload their housing stock and ascertain the social characteristics of the people they house. However, even a quick play with the tool suggests that a much wider range of unintended users – policy-makers and programme designers across government and other public service areas – might be beneficiaries. A number of local authorities, for example, facing significant cuts to their in house capacity to collect and analyse data have expressed interest in embedding Community Insight in order to retain the ability to access information on the communities they work within.

Business model

Community Insight is sold on a subscription basis, with subscribing organisations having unlimited staff access to the tool across their business. They are able quickly to produce comparable reports on different geographical areas as the need arises. OCSI and HACT ensure the data is constantly updated and will continue to develop and improve the resource over time. Subscribers report an immediate reduction in the costs of community profiling consultancies (for some housing associations paying back the annual subscription in a matter of weeks), little to no installation or maintenance overhead (as all data is updated centrally) and minimal training requirements for new users.

Selection of headline indicators from the  Community Insight Report on Emmaville (a fictitious village).

Emmaville overview

 Statistics for each selected geographical area

  • population by number, age, gender, dependency ratio, population size over the last 10 years, ethnicity and country of birth, migration statistics, household composition, religion
  • number of types of houses e.g. flats by local median price of each, renting and ownership proportions, trends in house price over the last 6 years, central heating, overcrowding and dwelling size, local communal residential establishments
  • vulnerable groups by types of benefits claimed and number of claimants
  • crime by type recorded and 10 year trend
  • health by life expectancy and long-term illnesses, healthy eating, smoking and binge drinking
  • education by qualifications, pupil scores at key stage tests
  • economy by income, employment status and sector, job vacancies, local businesses, index of multiple deprivation, child wellbeing index
  • transport by car ownership, distance to key services
  • community by classification of type, feeling of neighbourhood satisfaction, active charities, air pollution

Potential uses

Following their roll-out in the housing sector, HACT and OCSI are considering where Community Insight might be applicable or adaptable to other sectors.  After my brief trial of the tool, my immediate thoughts for additional applications by potential non-housing provider users are:

  • designers of social impact bonds and other payment by results programmes might use the Community Insight tool to select an intervention cohort of appropriate size and need
  • researchers might use the tool to scan areas where they might focus their on-the-ground investigations
  • journalists might use the tool to describe the community a particular event has taken place in
  • local authorities might use the tool to educate their staff about the diversity and differences within their communities
  • social investors interested in place-based investing

What might you use it for?

Fewer criminals or less crime? Frequency v binary measures in criminal justice

The June 2013 interim results released by the Ministry of Justice gave us a chance to examine the relationship between the number of criminals and the number of crimes they commit. The number of criminals is referred to as a binary measure, since offenders can be in only one of two categories: those who reoffend and those who don’t. The number of crimes is referred to as a frequency measure, as it focuses on how many crimes a reoffender commits.

The payments for the Peterborough SIB are based on the frequency measure. Please note that the interim results are not calculated in precisely the same way as the payments for the SIB will be made. [update: the results from the first cohort of the Peterborough SIB were released in August 2014 showing a reduction in offending of 8.4% compared to the matched national comparison group.]

In the period the Peterborough SIB delivered services to the first cohort (9 Sept 2010-1July 2012), the proportion of crimes committed over the six months following each prisoner’s release reduced by 6.9% and the proportion of criminals by 5.8%. In the same period, there was a national increase in continuing criminals of 5.4%, but an even larger increase of 14.5% in the number of crimes they commit. The current burning issue is not that there are more reoffenders, it is that those who reoffend are reoffending more frequently.

Criminals or crime 1Criminals (binary measure) in this instance are defined as the “Proportion of offenders who commit one or more proven reoffences”. A proven reoffence means “proven by conviction at court or a caution either in those 12 months or in a further 6 months”, rather than simply being arrested or charged.

Crime (frequency measure) in this instance is defined as “Any re-conviction event (sentencing occasion) relating to offences committed in the 12 months following release from prison, and resulting in conviction at court either in those 12 months or in a further 6 months (Note: excludes cautions).”

The two measures are related – you would generally expect more criminals to commit more crimes. But the way reoffending results are measured creates incentives for service providers. If our purpose is to reduce crime and really help those who impose the greatest costs on our society and justice system, we would choose a frequency measure of the number of crimes. If our purpose is to help those who might commit one or two more crimes to abstain from committing any at all, then we would choose a binary measure.Criminals or crime 2Source of data: NSW Bureau of Crime Statistics and Research

The effect of the binary measure in practice: Doncaster Prison

A Payment by Results (PbR) pilot was launched in October 2011 at Doncaster Prison to test the impact of a PbR model on reducing reconvictions. The pilot is being delivered by Serco and Catch22 (‘the Alliance’). The impact of the pilot is being assessed using a binary outcome measure, which is the proportion of prison leavers who are convicted of one or more offences in the 12 months following their release. The Alliance chose to withdraw community support for offenders who are reconvicted within the 12 month period post-release as they feel that this does not represent the best use of their resources. Some delivery staff reported frustration that support is withdrawn, undermining the interventions previously undertaken. (Ministry of Justice, Process Evaluation of the HMP Doncaster Payment by Results Pilot: Phase 2 findings.)

I have heard politicians and policy makers argue that the public are more interested in reducing or ‘fixing’ criminals than helping them offend less, and thus the success of our programmes needs to be based on a binary measure. I don’t think it’s that hard to make a case for reducing crime. People can relate to a reduction in aggravated burglaries. Let’s get intentional with the measures we use.

What do the Peterborough SIB interim results tell us?

Update: actual results are now out.

First cohort results from the Peterborough SIB were released August 7 2014. The Social Finance UK press release on the results has lots of great information, with a quote below.

“Results for the first group (cohort) of 1000 prisoners on the Peterborough Social Bond (SIB) were announced today, demonstrating an 8.4% reduction in reconviction events relative to the comparable national baseline. The project is on course to receive outcome payments in 2016. Based on the trend in performance demonstrated in the first cohort, investors can look forward to a positive return, including the return of capital, on the funds they have invested.”

Outdated information below:

Peterborough Interim ResultsOn the 13th of June, the Ministry of Justice released interim results from the Peterborough Pilot SIB. The results were seen as very encouraging, although Social Finance stressed that the results “do not measure  reoffending behaviour over as long a period as the Social Impact Bond will be judged and are not compiled on precisely the same basis as will be used by the Independent Assessor during the course of 2014 to determine whether a payment is due.”

What the results do tell us

The results tell us that the reoffending events have improved in the Peterborough cohort as the national average has worsened. We can be fairly confident that the reduction in reoffending is due to the Peterborough SIB, or more specifically the One Service. This in itself is quite an achievement for Government policy.

These results are also an excellent demonstration of the need to have a contemporary comparison, in this case the Police National Computer control group, rather than a historical baseline. If the historical re-conviction rates at Peterborough had been used as the only comparison, it would appear that a 6% reduction had been produced. Using the national comparison group shows that the programme also counters an increasing trend in re-convictions to produce a relative reduction of 23%. The inability of historical baselines to represent the fluctuating environment affecting reoffending is further illustrated when we look at results leading up to the 2010 launch of the One Service. The graph below shows that reoffending by both Peterborough inmates and prisoners across the nation was increasing until SIB services began in 2010, but then reversed in comparison to the national rates.

Peterborough Interim Results 2

What the results don’t tell us

The results do not tease out for us which aspects of the One Service might be more or less responsible for success. So, the results do not tell us if the reduction in reoffending is due to the:

  • use of volunteer mentors
  • voluntary, rather than mandatory, participation
  • long-term nature of the SIB funding
  • flexibility of funding
  • ability to innovate programme delivery to optimise outcomes
  • focus on a single outcome
  • extraordinary skills of the people involved in managing and delivering services
  • continuous evaluation and improvement of the One Service
  • discipline of reporting to external investors
  • alignment of financial and social returns.

The April 2014 evaluation commissioned by the Ministry of Justice from Rand Europe sheds some light on the perceived benefits of the SIB model, including the way the flexibility of funding allows for the service to improve in response to performance management data.

Update April 2014

See 24 April results and press release from the Ministry of Justice stating “Before the pilot, for every 100 prisoners released from Peterborough there were 159 reconviction events annually. Under the scheme this figure has fallen to 141 — a fall of 11 per cent. Nationally that figure has risen by 10 per cent over the same period.”

Toby Eccles blog analyses how well the Peterborough SIB achieved its objectives to:

  • Enable innovation
  • Enable flexibility and focus on outcomes
  • Bring rigour to prevention
  • Better alignment
  • Investment in social change.

And a good analysis of the Peterborough journey and what was learnt is given by the Social Spider here. I have a slightly broader view of SIBs in the context of policy reform, but I like the discussion.

References

Ministry of Justice, Statistical Notice: Interim re-conviction figures for the Peterborough and Doncaster Payment by Results pilots12 June 2013.

Social Finance, Interim Re-Conviction Figures for Peterborough Social Impact Bond Pilot, press release 13 June 2013.

Ministry of Justice, Mentoring Scheme Reduces Reoffending, press release 13 June 2013.

Vibeka Mair, Peterborough social impact bond has slashed reoffending rates says MoJ, Civil Society Finance, 13 June 2013.

Alan Travis, Pilot schemes to cut reoffending show mixed results, The Guardian, 13 June 2013.

BBC, Prison payment-by-results schemes see reoffending cut, 13 June 2013.

Nicholls, A. & Tomkinson,E. Case Study – The Peterborough Pilot Social Impact Bond – Oct 2013, Oct 2013.

Making the economic case to government

CBA

Public agencies commissioning social impact bonds or other payment by results programmes want to see some kind of cost benefit analysis. But they might not always be so willing to provide the information an external organisation needs accurately estimate the benefit side. Different commissioners also have different requirements for cashable savings – for some it’s a key driver and for others it’s not a consideration.

I suggest that collecting benefits into the following five categories makes the information for the commissioner much clearer and, for UK commissioners, also explicitly addresses the requirements of the Social Value Act. All estimated amounts should be itemised and if an external applicant is unsure of the savings or benefits to public service agencies, then they should present a best estimate that prompts the commissioner to provide a more accurate figure. The Global Value Exchange is a database of proxy values that will be helpful for this.

Estimated amount
Cashable savings to commissioner(s)
Cashable savings to other public agencies
Non-cashable benefits / efficiency savings to commissioner(s)
Non-cashable benefits / efficiency savings to other public agencies
Savings/benefit to other stakeholders (social value)
Total economic benefit  

Three examples of public engagement in policy development

(from www.socialbrite.org)

The Social Impact Bond Knowledge Box I produced for the Centre for Social Impact Bonds at the Cabinet Office (UK) includes contributions from many external individual contributors. It provides opportunity for users to comment on or suggest edits for each page and submit links to their own work in order to keep the resource up-to-date. It was inspired by these three examples of policy interactions with the public:

1. The White House has a petition site called ‘We the People’ that promises a response to petitions that raise over 25,000 signatures. In 2012, a petition to “Secure resources and funding, and begin construction of a Death Star by 2016” received the requisite signatures, and the White House used their humorous response to promote domestic innovations and the study of science, technology, engineering and maths.

2. In November last year the Cabinet Office (UK) launched an on-line consultation seeking public views on the new datasets code of practice that will be issued under Section 45 of FOIA. It set out the amendment with a comment box under each clause, inviting the public to make comments or specific edits. While the consultation helped the team refine the amendment in light of users’ responses, it was also intended as an educational exercise, to “make public authorities aware of their new responsibilities under the new FOIA ‘datasets’ sections.” The consultation is now closed.

3. The London Assembly encourages the public to take part in their processes by:

  • Participating in consultations
  • Suggesting something to investigate
  • Putting a question to the Mayor
  • Asking an Assembly Member to present a petition on their behalf
  • Subscribing to their monthly ezine.

Check out Govloop’s Citizen Engagement Hub that’s packed with resource links and their guide Innovating at the Point of Citizen Engagement: Making Every Moment Count which includes seven inspirational stories.

What other examples are there of government crowd-sourcing their policy development?

Randomised controlled trials (RCTs) in public policy

RCT

The basic design of a randomised controlled trial (RCT), illustrated with a test of a new ʻback to workʼ programme (Haynes et. al, 2012, p.4).

In 2012, Laura Haynes, Owain Service, Ben Goldacre & David Torgerson wrote the fantastic paper Test, Learn, Adapt: Developing Public Policy with Randomised Controlled Trials. They begin the paper by making the case for RCTs with the following four points.

1.We don’t necessarily know ‘what works’ – “confident predictions about policy made by experts often turn out to be incorrect. RCTs have demonstrated that interventions which were designed to be effective were in fact not”

2. RCTs don’t have to cost a lot of money – “The costs of an RCT depend on how it is designed: with planning, they can be cheaper than other forms of evaluation.”

3. There are ethical advantages to using RCTs – “Sometimes people object to RCTs in public policy on the grounds that it is unethical to withhold a new intervention from people who could benefit from it.” “If anything, a phased introduction in the context of an RCT is more ethical, because it generates new high quality information that may help to  demonstrate that an intervention is cost effective.”

4. RCTs do not have to be complicated or difficult to run – “It is much more efficient to put a smaller amount of effort [than a post-intervention impact evaluation] into the design of an RCT before a policy is implemented.”

Laura and her team are making a huge difference to the way the UK Government perceives and implements RCTs.

The World Bank has also published some fantastic guidance in their  Impact Evaluation OverviewThis includes information abou their  Development Impact Evaluation (DIME) initiative that has the following objectives:

  • “To increase the number of Bank projects with impact evaluation components;
  • To increase staff capacity to design and carry out such evaluations;
  • To build a process of systematic learning based on effective development interventions with lessons learned from completed evaluations.”

I’ve popped both these resources on the Social Impact Bond Knowledge Box page Comparisons and the counterfactual, but thought they were so valuable it was worth expanding on them here.

Start a mistakes log

mistakes“No one is exempt from the rule that learning occurs through recognition of error.” Alexander Lowen, Bioenergetics

There’s too many lessons we’re missing out on because of our tendency to only publish good results. It’s perfectly understandable to want to promote wins, but publishing mistakes and what’s been learned from the them may be even more valuable.

Ben Goldacre is crusading against publication bias in evidence based medicine. He is one of the forces behind http://www.alltrials.net/, an online petition to get all medical trials registered and subsequently all results reported. This is important stuff.

But apart from medicine, those of us involved in designing and delivering social programmes continue to repeat the mistakes of the past, because we simply don’t know enough about what has happened. I’m a strong believer in evidence-based policy, but evidence of policy history and why things failed is rarely captured and shared. Might it be possible for us to value mistakes enough to create incentives for their publication?

Curt Rosengren writes in his blog, the genius of mistakes:

You might even try keeping a mistake genius journal. Not a place for you to berate yourself for how many mistakes you make, but a place for you to actively learn from what has happened. Explore the mistake, explore what insights you’ve gained as a result, and summarize those insights into key points.

One organisation that’s created a ‘mistakes genius journal’ is Givewell in the US, with a section on their website, Our Shortcomings, logging their mistakes and what they’ve done in response. My opinion of the organisation was heightened by this discovery and I thought that this honest recognition and promotion of continuous improvement might have had the opposite effect most would expect from publishing their mistakes. Yes, we’re all worried about tabloid headlines, but wouldn’t it be a little less exciting when it’s not a secret ‘uncovered’, but a quote from the source straight off their public website. Imagine how wonderful it would be if governments and service providers kept similar logs!

As we try to design new services and financial products to address entrenched problems in this emerging social investment market, it would be really valuable to know what didn’t work out for others and most importantly, what they changed in response.

Allia recently showed an exemplary commitment to learning following the closure of their Future for Children Bond, which was the first opportunity for retail investors to invest a proportion of funds in a social impact bond, but failed to raise sufficient capital.

As a first pilot product, the Future for Children Bond has nevertheless been hugely valuable in assessing the retail market for social investment and generating learning about the steps needed to enable it to grow. These lessons will be used to inform the development of future Allia products and will be shared with the sector, together with policy recommendations, in a report by NPC to be published in May.

So here’s to seeing a whole lot more mistakes logs and lessons learned appearing in the public domain – great PR and enhanced social impact – what is there not to like?