Evidence-based justice – or NOT!

It’s hard to generate good evidence on which to base policy and programs. It’s even harder when that evidence exists, is publicly available and blatantly ignored.

Let’s talk about generating evidence first…

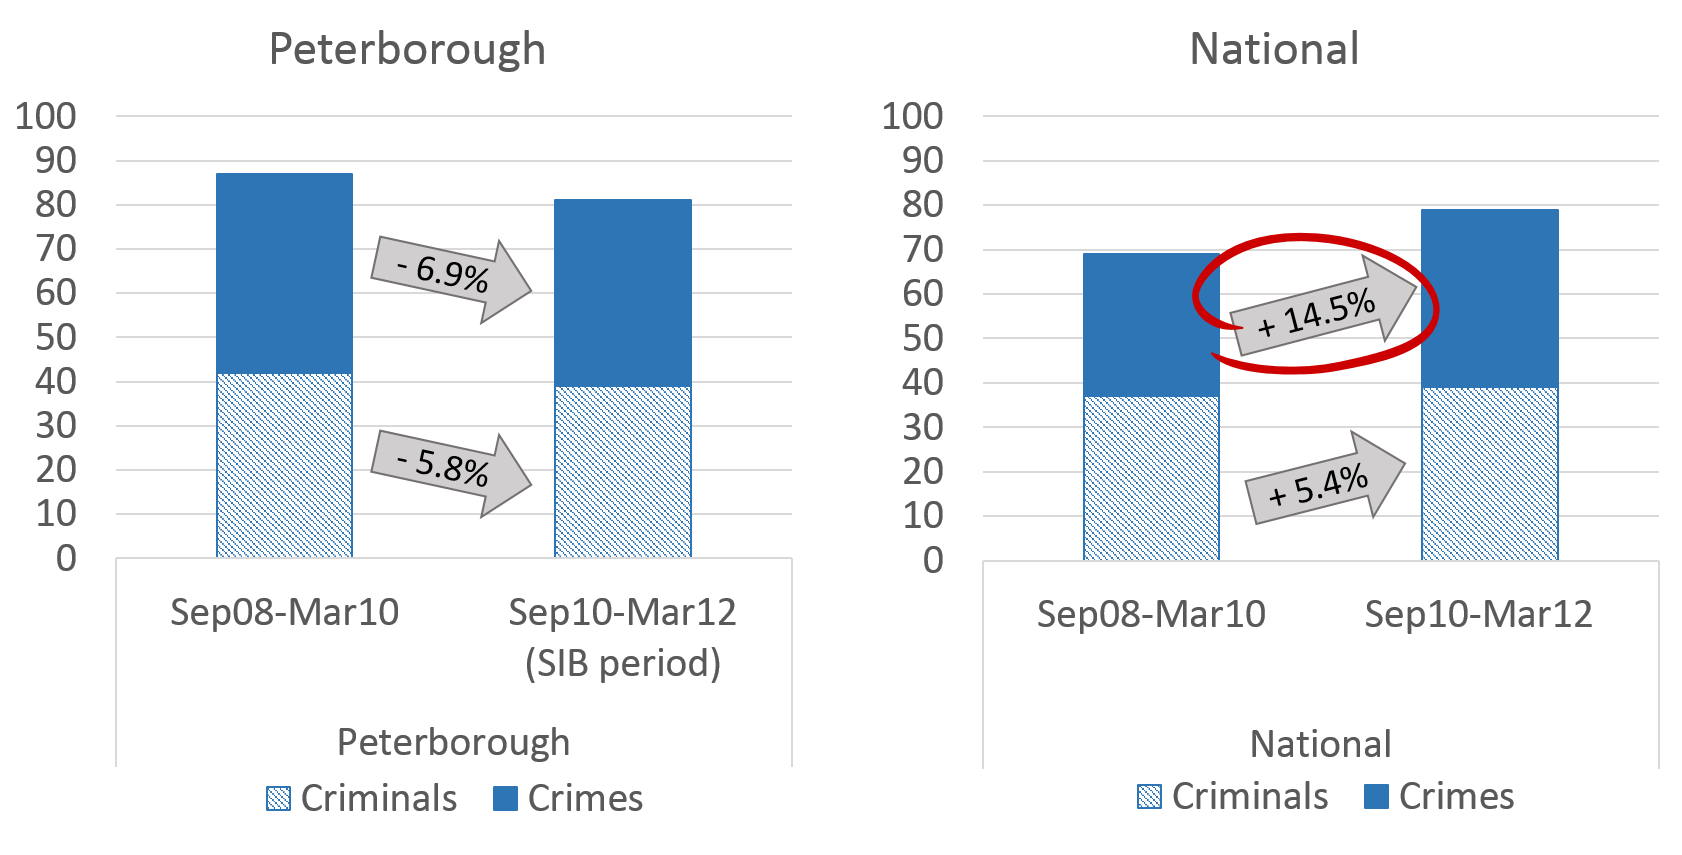
Sometimes when we talk about comparing a group receiving services to a group not receiving services, it is argued that it is unethical to deny anyone a service (this always comes up when planning social impact bonds and other pay for success programs). There is an underlying assumption in this argument that all services are beneficial to their recipients. Results from the Justice Data Lab in the UK show that services are not always beneficial, as some programs that intended to reduce reoffending actually increased reoffending.

Justice Data Lab Oct results

The Justice Data Lab was launched on a trial basis in April 2013. For organisations delivering services to reduce reoffending, it provided the first opportunity to have an effect size calculated against a matched national comparison group, for no financial cost. A key condition of the Justice Data Lab was that the Ministry of Justice would publish all results.

For more information on how the Lab works, see the brief summary I wrote last year.

Critics of the Justice Data Lab point out that organisations are able to choose which names they submit, so are able to bias the results. Despite this, not all results have been positive.

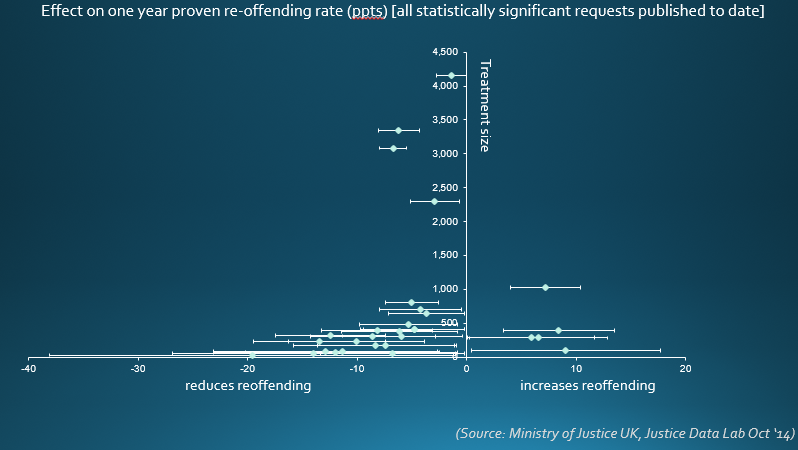
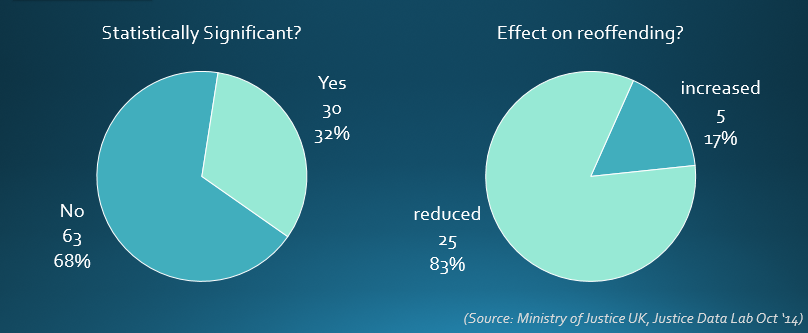
Up to October 2014, 93 programs have applied. Only 30 of these had statistically significant results. Of these, 25 were shown to reduce reoffending and five increased reoffending.

Justice Data Lab Oct results 2

[Technical note: Non-statistically significant results could be due to a number of features in combination, including small effect size (difference between those receiving the service and similar ex-offenders not receiving the service), small sample size (how many people were in the program) and low matching rate. The Justice Data Lab requires that at least 60 people’s names be submitted for matching with similar ex-offenders, but is not always able to match them all. If only 30 offenders were able to be matched, the program would have to have an effect size of at least 15 percentage points in order for the result to be statistically significant with 95% confidence. That is very high – only one of the programs so far has produced a difference of greater than 15 percentage points. (A confidence level of 95% means that if the program were repeated 100 times, at least 95 times the observed effect would be due to the program and the remaining times the observed effect would occur by chance.)]

The UK is currently undergoing a huge policy reform, Transforming Rehabilitation. What role the Justice Data Lab and its results will play in this process is unknown. Sometimes the hardest part of the evidence cycle is making decisions that reflect the evidence.

Disney’s anti-evidence programmingBeyond Scared Straight

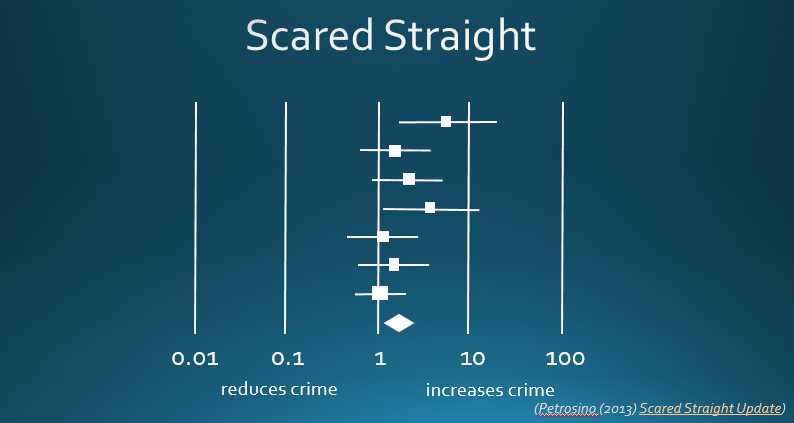
Perhaps the most notorious of programs that consistently increases reoffending is Scared Straight. Scared Straight involves taking young people into prisons, where they speak to incarcerated offenders and ‘experience’ being locked up. The idea is that they’re so shocked by what they see they will never offend themselves and risk a life behind bars. Unfortunately, for the young people participating in these programs, the incidence of prison increases.

Scared Straight programs spread across the US after a documentary of the same name won an Academy Award in 1979. The effect of many of these programs was not evaluated, but there were two studies published only a few years later, in 1982 and 1983, showing that out of seven evaluations, not once did the program reduce reoffending, and that overall the program increased reoffending. These analyses have been repeated several times, but the results remain the same (Petrosino (2013) Scared Straight Update).

Scared Straight

Despite this evidence being publicly available and fairly well known, in January 2011, the Disney-owned TV channel A&E began to broadcast their new series Beyond Scared Straight. The program follows “at-risk teens” and is “aimed at deterring them from a life of crime”. Despite outcry, public condemnation and petitions, the channel refuses to cancel the series, which is about to enter its eighth season.

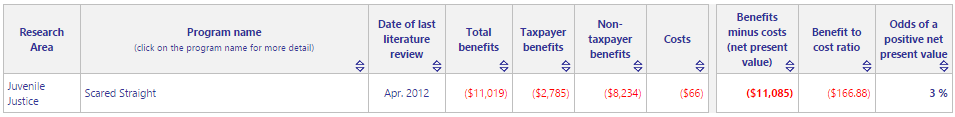
The Washington State Institute for Public Policy estimates that each dollar spent on Scared Straight programs incurs costs of $166.88, making it the only juvenile justice program in their list with a negative cost:benefit ratio (see their summary below).

WSIPP Scared Straight

For the young people enticed into the program, their prize is not only a terrifying experience, but a greater likelihood of a stint in one of the unhappiest places on Earth.

Useful references

The Cochrane Collaboration – systematic reviews of evaluations in health.

The Campbell Collaboration – sister of Cochrane for other policy areas e.g. where the Scared Straight update is published.

Test, Learn, Adapt: Developing Public Policy with Randomised Controlled Trials – from the UK Cabinet Office clearly sets out how public programs can use randomised controlled trials to develop evidence-based programs. Rather than ‘denying’ service, the authors encourage randomisation of rollout of a new program, for example, as a cost-neutral way of enabling better data collection and learning.

Creating a ‘Data Lab’ – from NPC, about submitting the proposal that initiated the Justice Data Lab and continuing work to seed similar programs in other service areas.

Transforming Rehabilitation: a summary of evidence on reducing reoffending (second edition) – 2014 – published by the Ministry of Justice

What Works to Reduce Reoffending: A Summary of the Evidence – 2011 – published by the Scottish Government

The Justice Data Lab – an overview

MoJ Data LabWhat is the Justice Data Lab?

The Justice Data Lab allows non-government organisations to compare the reoffending of the participants in their programmes with the reoffending of other similar ex-offenders. It “will allow them to understand their specific impact in reducing re-offending… providing easy access to high-quality re-offending information” (Ministry of Justice, Justice Data Lab User Journey p.10). There is no charge to organisations that use the Justice Data Lab.

The Justice Data Lab is a pilot run by the Ministry of Justice. The pilot began in April 2013. Each month, summaries of results and data are published, including Forest plots of all results so far.

Who might use it?

The Justice Data Lab can be used by “organisations that genuinely work with offenders” (Justice Data Lab User Journey p.11). One request will provide evidence of a programme’s effect on its service users’ reoffending. Several requests could compare services within an organisation or over time to answer more sophisticated questions about what is more effective.

This information could be used by non-government organisation for internal programme improvements, to report impact to stakeholders or to bid for contracts. It was set up at the time the Ministry of Justice’s Transforming Rehabilitation Programme was encouraging bids from voluntary and community sector organisations to deliver services to reduce reoffending.

What are the inputs?

Input data are required to identify the service users from a specific program and match them with a comparison group. Information on at least 60 service users is required and the organisation must have worked with the offender between 2002 and 2010.

Essential:

  • Surname
  • Forename
  • Date of Birth
  • Gender

At least one of the following:

  • Index Date
  • Conviction Date
  • Intervention Start Date [note: feedback from applicants is that this is required]
  • Intervention End Date [note:feedback from applicants is that this is required]

Highly Desirable: PNC ID and/or Prison Number

Optional: User Reference Fields

What are the outputs?

The one year proven re‐offending rate –  defined as the proportion of offenders in a cohort who commit an offence in a one year follow‐up period which received a court conviction, caution, reprimand or warning during the one year follow‐up or in a further six month waiting period. The one year follow‐up period begins when offenders leave custody or start their probation sentence. A fictional example of the output provided by the Ministry of Justice is quoted below:

The analysis assessed the impact of the Granville Literacy Project (GLP) on re‐ offending. The one year proven re‐offending rate for 72 offenders on the GLP was 35%, compared with 41% for a matched control group of similar offenders. The best estimate for the reduction in re‐offending is 6 percentage points, and we can be confident that the reduction in re‐offending is between 2 and 10 percentage points.
What you can say: The evidence indicates that the GLP reduced re‐offending by between 2 and 10 percentage points.

Publication
Applicants should note the following requirement: “an organisation requesting data through the Justice Data Lab must publish the final report, in full, on the organisation’s website within four months of receiving the final report.”

I’d be very interested in the opinions of applicants on this requirement. Is it an issue? Does it create perverse incentives?

What are the implications?

The implications are huge. Prior to the Justice Data Lab it was very difficult for non-government organisations to establish a comparison group against which to measure their effect. Evaluations of effect are expensive and thus prohibitive, particularly for smaller organisations. In addition, the differences in their methods and definitions meant that evidence was more difficult to interpret and compare.

This is exactly the type of evidence that developers of social impact bonds find so difficult to establish and will be essential to constructing social impact bonds to deliver  Transforming Rehabilitation services. It is a measure of outcome, which is desirable, but often more difficult to quantify than input (e.g. how much money went into the programme), activity (e.g. what services were delivered) or output (e.g. how many people completed the programme).

New Philanthropy Capital (NPC) were involved in designing the Justice Data Lab and their Data for Impact Manager, Tracey Gyateng, is specifically thinking about applications to other policy areas.

How is it going?

See my November 2014 post on information coming out of the Justice Data Lab.

Also note the announcement of an Employment Data Lab by NPC and the Department of Work and Pensions.

More information

Information on the Justice Data Lab home page includes links to a series of useful documents:

  • User journey document – information on what the justice data lab is, and how to use its services.
  • Data upload template – use this template to supply data to the justice data lab. Further descriptions of the variables requested are given, and there are key areas which must be filled in on the specific activities of the organisation in relation to offenders.
  • Methodology paper – this document gives details of the specific methodology used by justice data lab to generate the analysis
  • Privacy impact assessment – this is a detailed analysis of how an organisations’ data will be protected at all stages of a request to the justice data lab
  • Example report template – two examples of a standard report, completed for two fictional organisations showing what will be provided.

Criminal justice service providers might also benefit from getting involved in the Improving Your Evidence project, a partnership between Clinks, NPC and Project Oracle. The project will produce resources and support, so follow the link and let them know what would be of most use. The page also links to an introduction to the Justice Data Lab – a useful explanation of the service.

The bulk of this post has been copied directly from the Ministry of Justice documents listed above. It is intended to act as a summary of these documents for quick digestion by potential users of the Justice Data Lab. The author is not affiliated with the Ministry of Justice and does not claim to represent them.

Fewer criminals or less crime? Frequency v binary measures in criminal justice

The June 2013 interim results released by the Ministry of Justice gave us a chance to examine the relationship between the number of criminals and the number of crimes they commit. The number of criminals is referred to as a binary measure, since offenders can be in only one of two categories: those who reoffend and those who don’t. The number of crimes is referred to as a frequency measure, as it focuses on how many crimes a reoffender commits.

The payments for the Peterborough SIB are based on the frequency measure. Please note that the interim results are not calculated in precisely the same way as the payments for the SIB will be made. [update: the results from the first cohort of the Peterborough SIB were released in August 2014 showing a reduction in offending of 8.4% compared to the matched national comparison group.]

In the period the Peterborough SIB delivered services to the first cohort (9 Sept 2010-1July 2012), the proportion of crimes committed over the six months following each prisoner’s release reduced by 6.9% and the proportion of criminals by 5.8%. In the same period, there was a national increase in continuing criminals of 5.4%, but an even larger increase of 14.5% in the number of crimes they commit. The current burning issue is not that there are more reoffenders, it is that those who reoffend are reoffending more frequently.

Criminals or crime 1Criminals (binary measure) in this instance are defined as the “Proportion of offenders who commit one or more proven reoffences”. A proven reoffence means “proven by conviction at court or a caution either in those 12 months or in a further 6 months”, rather than simply being arrested or charged.

Crime (frequency measure) in this instance is defined as “Any re-conviction event (sentencing occasion) relating to offences committed in the 12 months following release from prison, and resulting in conviction at court either in those 12 months or in a further 6 months (Note: excludes cautions).”

The two measures are related – you would generally expect more criminals to commit more crimes. But the way reoffending results are measured creates incentives for service providers. If our purpose is to reduce crime and really help those who impose the greatest costs on our society and justice system, we would choose a frequency measure of the number of crimes. If our purpose is to help those who might commit one or two more crimes to abstain from committing any at all, then we would choose a binary measure.Criminals or crime 2Source of data: NSW Bureau of Crime Statistics and Research

The effect of the binary measure in practice: Doncaster Prison

A Payment by Results (PbR) pilot was launched in October 2011 at Doncaster Prison to test the impact of a PbR model on reducing reconvictions. The pilot is being delivered by Serco and Catch22 (‘the Alliance’). The impact of the pilot is being assessed using a binary outcome measure, which is the proportion of prison leavers who are convicted of one or more offences in the 12 months following their release. The Alliance chose to withdraw community support for offenders who are reconvicted within the 12 month period post-release as they feel that this does not represent the best use of their resources. Some delivery staff reported frustration that support is withdrawn, undermining the interventions previously undertaken. (Ministry of Justice, Process Evaluation of the HMP Doncaster Payment by Results Pilot: Phase 2 findings.)

I have heard politicians and policy makers argue that the public are more interested in reducing or ‘fixing’ criminals than helping them offend less, and thus the success of our programmes needs to be based on a binary measure. I don’t think it’s that hard to make a case for reducing crime. People can relate to a reduction in aggravated burglaries. Let’s get intentional with the measures we use.

Lower crime AND incarceration?

prison bed

A bunch of very effective and well-evidenced programs from the US.

I had the good fortune to attend a presentation by Mark Kleiman, given to the members of the NSW Government Better Evidence Network in late 2013. I was incredibly impressed. This was the best presentation on evidence-based criminal justice programs I’ve ever seen.

As the Ministry of Justice in the UK consults on their new approach to probation, I think it’s timely to check out the parole approaches promoted by Kleiman.

Basically, Kleiman argues that parole systems offering severe, delayed punishment are ineffective and the approaches that work are “swift-certain-not-severe”. Read his article A New Role for Parole – he says it so well I find it hard to add anything!

I’ll throw in a quote and let you research the details of these programmes yourself.

The best-publicized program built on this set of principles is the HOPE program in Honolulu, which requires random drug tests of probationers and, for those who fail, an immediate short stint (typically two days) in jail, with no exceptions. The SWIFT program in Texas, the WISP program in Seattle, the Swift and Sure program in Michigan, and Sobriety 24/7 in South Dakota all work the same way, and all have the same results: drastic reduction in illicit-drug use (or, in the case of 24/7, alcohol abuse), reoffending, revocation, and time behind bars.

There’s nothing surprising about the fact that this approach works—it’s simply the application of well-known behavioral principles to a fairly straightforward problem. What is surprising is how well it works. In Hawaii, HOPE clients are mostly longtime criminally active drug users with a mean of seventeen prior arrests. A drug treatment program would be delighted if it could get 20 percent of such a population into recovery—and most would quickly drop out and go back to drug use. But in a carefully done randomized controlled trial with 500 subjects, eight out of ten assigned to the HOPE program finished the first year of the program in compliance and drug free for at least three months, with no rearrest. Most of them either never had a missed or dirty test (which would have led to a forty-eight-hour jail stay) or had only one such incident. That suggests that more than mere deterrence is at work; HOPE clients seem to be gaining the ability to control their own behavior.