
Australian update: Community Insight Australia is working to shape and translate the Community Insight tool for Australia. Please get in touch if you share our vision and would like to take the journey with us.
Policy-makers know that social programmes are more effective if they are provided in the areas of greatest need. But, historically, it has been resource intensive to identify either areas of need or the range of needs of a particular community. This task would either involve weeks of combing through the latest data from all reliable sources or painstakingly interviewing a large enough sample to make assumptions about the populations. As a public servant, I’ve spent hours on the computer painting maps of social disadvantage, a new map for each indicator.
This problem is also faced by Housing Associations and other social housing landlords, who provide homes to over 4.5m households across England, and operate in an environment in which accurate data about communities they work within has become increasingly important to policy and delivery decisions. Their ability to access relevant data has been limited by poor quality data systems and a reliance on a limited pool of research analysts to interpret the data that was available.
In response to this, new housing think-do tank HACT and social policy data experts OCSI recently launched Community Insight, a web-based tool which allows non-expert staff at all levels to explore geographically social indicators of need quickly and easily for the first time, using constantly-updated, reliable data.
I was lucky enough to have Matt Leach, from HACT, take me through Community Insight and I couldn’t have been more impressed. The key to the tool is its simplicity.
- You choose the geographic area you are interested in on a map of England and Wales.
- The tool will give you the demographic and social indicators of the area.
Screenshot of Community Insight showing a selected area, specific houses by housing type, social indicator categories on the left and colours on the map showing the density of the chosen indicator, mental health issues.

Features:
- the social indicators are also presented in comparison to the national average
- information about a geographical area can be interacted with online or exported in seconds as a detailed report
- you can drill down by area or statistical collection for more information
- the statistical collections behind the tool are automatically updated as their sources are updated
- geographical areas can be defined specifically by a spreadsheet of housing stock or drawn with your finger or a mouse onto a map as a suburb, county or region.
Some of the ways housing providers are using Community Insight could transfer to policy makers and programme designers:
- comparing between different areas in order to target community investment programmes to areas of greatest ‘need’
- assessing change over time in different areas, as a starting point for evaluation of programme impact
- combining with more detailed data from administrative data sets, to develop ‘at-risk models’ to identify areas and properties (and indeed individuals) that might be at risk e.g. of rent arrears
The tool is notable for a number of reasons:
- it is one of the first large scale commercial approaches to accessing and interpreting open data launched by a UK-based social enterprise in a major public service area
- it was designed from the bottom up as a tool for practitioners (one of the design principles that drove the team was “democratising data”)
- it has had instant, mainstream success, with over 60 landlords with a total stock in management of nearly 1m households subscribing to the service within 4 months of its launch
- it’s incredibly easy to use and the data produced is fit for purpose.
Easy to use
The tool was developed with its users involved at every step of the way. Rather than start with the data sets and try to make them interactive, the development of Community Insight was driven by the needs and intentions of the user. The intended users are housing providers – they can upload their housing stock and ascertain the social characteristics of the people they house. However, even a quick play with the tool suggests that a much wider range of unintended users – policy-makers and programme designers across government and other public service areas – might be beneficiaries. A number of local authorities, for example, facing significant cuts to their in house capacity to collect and analyse data have expressed interest in embedding Community Insight in order to retain the ability to access information on the communities they work within.
Business model
Community Insight is sold on a subscription basis, with subscribing organisations having unlimited staff access to the tool across their business. They are able quickly to produce comparable reports on different geographical areas as the need arises. OCSI and HACT ensure the data is constantly updated and will continue to develop and improve the resource over time. Subscribers report an immediate reduction in the costs of community profiling consultancies (for some housing associations paying back the annual subscription in a matter of weeks), little to no installation or maintenance overhead (as all data is updated centrally) and minimal training requirements for new users.
Selection of headline indicators from the Community Insight Report on Emmaville (a fictitious village).
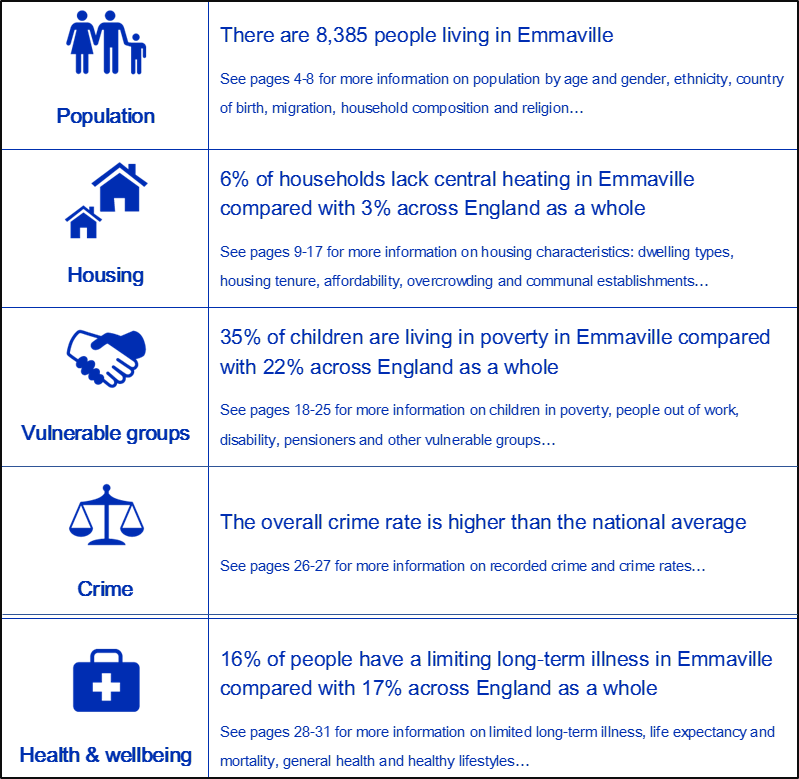
Statistics for each selected geographical area
- population by number, age, gender, dependency ratio, population size over the last 10 years, ethnicity and country of birth, migration statistics, household composition, religion
- number of types of houses e.g. flats by local median price of each, renting and ownership proportions, trends in house price over the last 6 years, central heating, overcrowding and dwelling size, local communal residential establishments
- vulnerable groups by types of benefits claimed and number of claimants
- crime by type recorded and 10 year trend
- health by life expectancy and long-term illnesses, healthy eating, smoking and binge drinking
- education by qualifications, pupil scores at key stage tests
- economy by income, employment status and sector, job vacancies, local businesses, index of multiple deprivation, child wellbeing index
- transport by car ownership, distance to key services
- community by classification of type, feeling of neighbourhood satisfaction, active charities, air pollution
Potential uses
Following their roll-out in the housing sector, HACT and OCSI are considering where Community Insight might be applicable or adaptable to other sectors. After my brief trial of the tool, my immediate thoughts for additional applications by potential non-housing provider users are:
- designers of social impact bonds and other payment by results programmes might use the Community Insight tool to select an intervention cohort of appropriate size and need
- researchers might use the tool to scan areas where they might focus their on-the-ground investigations
- journalists might use the tool to describe the community a particular event has taken place in
- local authorities might use the tool to educate their staff about the diversity and differences within their communities
- social investors interested in place-based investing
What might you use it for?
