Social impact bonds (SIBs) in Australia

Aussie SIB map
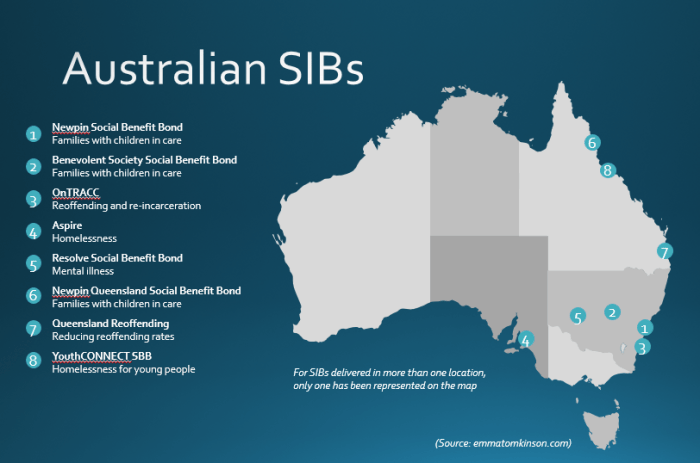
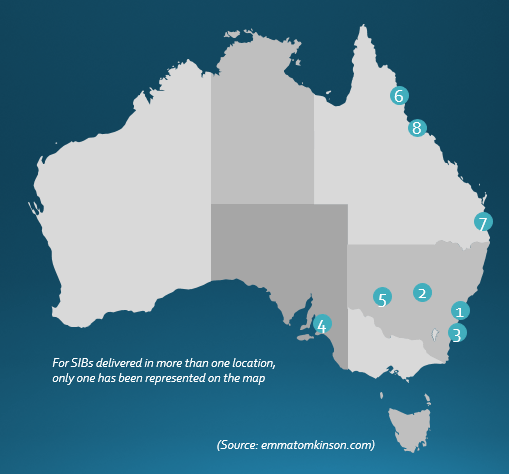
There have been eight social impact bond (SIB) contracts signed so far in Australia (I use this definition). Social impact bonds began being referred to as ‘social benefit bonds’ in the state of New South Wales in 2011. This was due to a new Government wanting to continue the previous Government’s social impact bond policy, but put their own stamp on it. The term has also been used by the Queensland Government.

SIB processes have been led by state governments

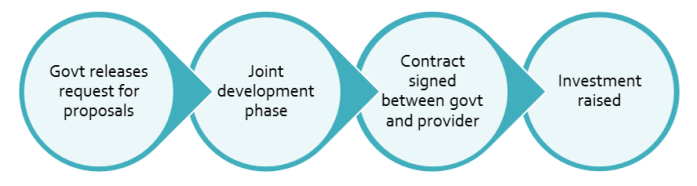
All social impact bonds in Australia have been initiated by state governments. Four of Australia’s six state governments have signed SIB contracts or are in the process of developing them. Each of these governments has pursued their SIB contracts by releasing an open request for proposals. New South Wales has released four that can be accessed here.

The requests for proposals have resulted in service providers being chosen, sometimes in partnership with financial intermediaries or other parties. They then enter what is referred to as a ‘joint development phase’ where the feasibility and details of contracts are established. Large not-for-profits in Australia are much larger and deliver across a wider range of services than in the UK, so they have the capacity and experience to negotiate directly with government, rather than through an intermediary. Many of these organisations generate millions of dollars income from government contracts annually, so are very experienced in government negotiations. The joint development phases have resulted in outcomes-based contracts between the state government in question and their chosen not-for-profit service providers. Not all projects that have entered this joint development phase have exited, with some projects deemed infeasible. It is worth noting that the first two SIBs have made changes to their payment metrics after observing them in practice.

Aussie SIB process.png

Investors

Five out of the six social impact bonds in Australia have raised funds on the open market, following the process above. This has resulted in a greater number and range of investors than SIBs in other parts of the world. Investors include trusts, foundations, institutions (including superannuation/pension funds), charities and high net worth individuals. Individual investment is restricted to ‘wholesale’ investors. A wholesale investor is a finance professional or a ‘sophisticated investor’ i.e. one who has an income of over AU$250,000 per annum for the last two years or assets in excess of AU$2.5 million. An offer restricted to wholesale investors safeguards retail investors from buying products they do not sufficiently understand and is cheaper to issue. The minimum investment for all SBBs has been AU$50,000. All SIBs have been oversubscribed, with the most recent round for NSW mental health and Queensland’s OOHC SIBs reaching their target in one month. One SIB, OnTRACC, is privately financed by a bank and service provider. There are links to the information memoranda of several SIBs in the details below. These documents provided the information for investors considering investment.

Intermediary roles

In some SIBs, intermediaries have only been involved in raising and managing investment, and are thus referred to as ‘financial intermediaries’. For other SIBs, they have been instrumental in program design and contract negotiation. But we haven’t seen them assume the roles of performance management or conducting ‘feasibility studies’ as is common overseas.

Attracting investment

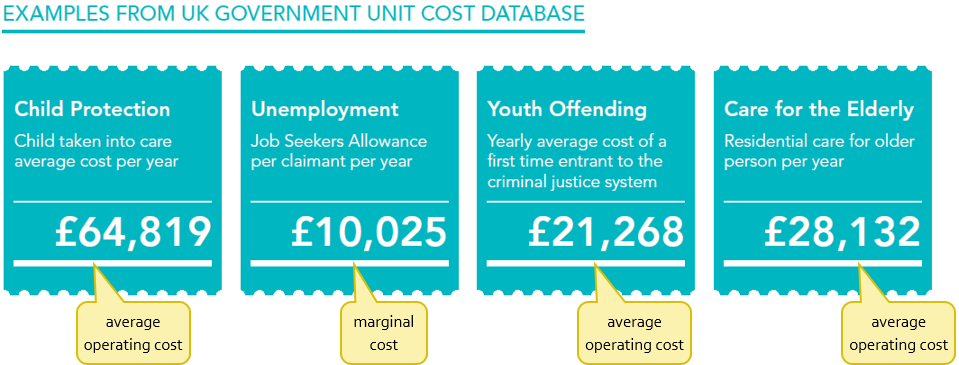
Government initiating the SIB process has led to the general perception that SIBs save governments a lot of money, and that governments should be actively enticing providers and investors to participate by sharing some of those savings.

Because the contract is signed before investors are sought, there is a need to make the SIB attractive to investors. If investors don’t sign up, the new service won’t happen and years of work is wasted. So this leads to a range of efforts to make the investment attractive that we haven’t seen elsewhere.

  1. Most Australian SIBs include a ‘standing charge’, where government pays a fixed amount (which can be up to 50% of contract value) regardless of outcome. In many other SIBs around the world, government payments are only made in response to outcome achievements. This was used in the Benevolent Society Social Benefit Bond to create a ‘guarantee’ of Principal for one tranche of investors.
  2. There are exit or termination points for investors, so that the program can be terminated if early results are not good, and the unspent proportion of the investment returned.
  3. Rates of return to investors are capped much higher than overseas – the maximum rate of return for one tranche of the Benevolent Society SBB is 30% IRR, in comparison to Peterborough’s 13% and Belgium’s 6%.
  4. Metrics were created that limited risk for investors. For example, the Newpin Social Benefit Bond funds separate programs for mothers and fathers, but as the fathers’ program had less evidence, it wasn’t included in the payment metric for investors. The fathers’ program was included in the payment metric for the charity providing the services.
  5. The media has been used to promote SIBs as an investment opportunity, with coverage of each investment opportunity including the national financial newspaper, the Australian Financial Review.

The eight SIBs – details and references

This information is provided to make it easier for researchers and other interested parties to access the range of information on Australian SIBs. It is all copied as faithfully as possible from original sources, but the original sources are still more reliable. The eight SIBs are listed in chronological order below, but are grouped by state below that. Clicking on the name of each SIB will take you to the information about it.

Aussie SIB map - map only.png

Chronological order Social Impact Bond (State) Status
1 Newpin Social Benefit Bond (NSW)

Families with children in care

Currently delivering services
2 Benevolent Society Social Benefit Bond (NSW)

Families with children in care

Currently delivering services
3 OnTRACC (NSW)

Reoffending and re-incarceration

Currently delivering services
4 Aspire (SA)

Homelessness

Currently delivering services
5 Resolve Social Benefit Bond (NSW)

Mental illness

Investment raised, yet to begin delivering services
6 Newpin Queensland Social Benefit Bond (QLD)

Families with children in care

Investment raised, yet to begin delivering services
7 Queensland Reoffending (QLD)

Reducing reoffending rates

Contracts signed, yet to raise investment.
8 YouthCONNECT SBB (QLD)

Homelessness for young people

Contracts signed, yet to raise investment.

New South Wales

Newpin Social Benefit Bond

(Source: NSW Office of Social Impact Investment)

Location Expanding from 4 to 7 locations throughout NSW
Service start date July 2013
Duration 7 years
Social Issue Restoring children from out-of-home care to their families and supporting families to prevent children entering care
Target population 700 families; more than half of which have at least one child aged six or under in out-of-home care
Outcome metric The restoration of children from out-of-home care to their families. All family restorations are independently decided by the NSW Children’s Court.
Outcome evaluation method The outcomes are compared to a live control group (for the first three years the comparison was an actuarial estimate).
Intervention Parents attend Newpin centres at least two days a week over 18 months. In this time, they are supported to develop their parenting skills, attend therapeutic support groups and interact meaningfully with their children.
Service Provider Uniting
Outcome Funder Department of Family and Community Services NSW
Upfront capital commitment (by investors) $7m  (total expected Government payments $47m)
Investors 59 wholesale investors + 1 retail investor, includes NG Super, Christian Super, Uniting (service provider), The Benevolent Society (charity), Emma Tomkinson (retail investor)
Other roles Financial intermediary: Social Ventures Australia
Maximum loss and return for investors Minimum Interest Rate = 5% p.a. over the first three years.

Maximum Interest Rate = 15% p.a. over the full term.

Maximum loss is 50% of Principal at the maturity date.

Payment schedule and thresholds Interest payments made annually. Principal Repayment repaid on the Maturity Date if the Restoration Rate over the full term is greater than 55%.
Investor payment dates 30 June 2014 (calculation date. Actual payments made later that year)
Results so far Newpin’s overall restoration rate for the first three years is 61 per cent, compared to 25 per cent for similar families with at least one child under the age of six that were not part of the program. Based on this performance, investor returns were 12.2 per cent for the first three years.

Sources and references:

Newpin Factsheet (June 2017 – by NSW Office of Social Impact Investment)

Information Memorandum for prospective investors (April 2013 – by SVA)

Back to list of SIBs

The Benevolent Society Social Benefit Bond

Location NSW
Service start date 2013
Duration 5 years
Social Issue Preventing children entering out-of-home care
Target population Up to 400 families who are expecting a child or have at least one child under six years of age (approximately 636 children), and who have been reported to Department of Family and Community Services as being at risk of significant harm. There are four annual cohorts, which will be used to calculate payments.
Outcome metrics Three key measures:

·         Out-of-home care entries

·         Helpline Reports from six months after entry to the service

·         Number of safety and risk assessments

A calculation is made using the three measures, and then adjusted for children that cannot be matched to the control and shortfall in referrals.

Outcome evaluation method Results are compared to a live control group and independently certified. Outcome measurements are taken throughout the investment and comparisons calculated annually.
Intervention Practical and therapeutic in-home support to at-risk families for up to 12 months, including 24/7 support during the first 12 weeks.
Service Provider The Benevolent Society
Outcome Funder Department of Family and Community Services NSW
Upfront capital commitment (by investors) $10m  (total cost of intervention $12.75m)
Investors Equity tranch: $2.5m from 17 investors

Principal protected tranch: $7.5m from 40 investors including NRMA Motoring & Services, Australian Ethical Investments, The Benevolent Society, Westpac Bank and Commonwealth Bank of Australia.

Other roles Financial intermediaries – Westpac Banking Corporation and the Commonwealth Bank of Australia
Maximum loss and return for investors Equity tranch: all capital at risk with maximum 30% return

Principal protected tranch: 100% capital guaranteed with maximum 10% return

Payment thresholds
Performance Class Performance Improvement Interest Return

(P tranch)

Interest Return

(E tranch)

Fail < 5% 0% 0%
Baseline >=5% <15% 5% 8%
Good 1 >=15% <20% 6% 11%
Good 2 >=20% <25% 7% 15%
Good 3 >=25% <35% 8% 20%
Good 4 >=35% <40% 9% 25%
Outperform >40% 10% 30%
Investor payment dates There is only one investor repayment – at the end (late 2018)
Results so far 2016 results showed that 21 per cent fewer children entered care compared to a control group. Investor returns will be calculated and paid after the bond ends. If returns were paid based on third year results, principal protected investors would receive a six per cent return and equity investors would receive a 10.5 per cent return

Sources and references:

The Benevolent Society Social Benefit Bond Factsheet

Benevolent Society 2016 Investor Report

Information memorandum for prospective investors, summarised in Presentation to investors

Back to list of SIBs

OnTRACC

This contract is not referred to as a Social Benefit Bond by the NSW Office of Social Investment, however it fits the definition I use, so I’m including it here.

Location Selected Sydney metropolitan areas
Service start date September 2016
Duration 5 years
Social Issue Parolee re-offending
Target population Up to 3,900 adult parolees with a medium to high risk of reoffending, released to supervision in selected Sydney metropolitan areas
Outcome metric Reduction in the re-incarceration rate of participating parolees in the 12 months after their release
Outcome evaluation method Participating parolees reoffending and re-incarceration will be compared to a randomly selected control group
Intervention The program provides participating parolees with enhanced support and referral services for up to 12 months following their release.
Service Provider Jointly delivered by the Australian Community Support Organisation (ACSO) and arbias
Outcome Funder Corrective Services NSW
Upfront capital commitment (by investors) Unknown
Investors Australian Community Support Organisation (ACSO) and NAB
Other roles Calculation of outcome metric: NSW Bureau of Crime Statistics and Research (BOCSAR)
Maximum loss and return for investors Unknown
Payment schedule and thresholds Unknown
Investor payment dates Unknown

NSW Office of Social Impact Investment OnTRACC Fact Sheet

http://www.osii.nsw.gov.au/news/2016/07/12/new-social-impact-investment-to-reduce-parolee-reoffending-and-re-incarceration/

Back to list of SIBs

Resolve SBB

Location Western NSW and Nepean Blue Mountains
Service start date Expected October 2017
Duration 7.75 years
Social Issue Mental illness
Target population Approximately 530 mental health patients in Western NSW and Nepean Blue Mountains local health districts
Outcome metric Percentage reduction in National Weighted Activity Units (NWAU – an activity measure for determining total health related service consumption, which also accounts for the severity and duration of services consumed, including hospital admissions) incurred by the individuals in the program over their two-year measurement periods relative to those incurred by a control group
Outcome evaluation method Results will be compared to a live control group
Intervention A residential program for periodic crisis care, community outreach support and a 24/7 “warm line” offering after hours phone support to provide advice and support before a crisis situation arises.

Each individual will receive recovery-orientated support for up to two years lead by peer workers who have a lived experience of a mental health issue.

Service Provider Flourish Australia
Outcome Funder NSW Health
Upfront capital commitment (by investors) $7 m (total expected Government payments $21.7m; possible range is $9m to $23.9m)
Investors The 50 investors range from high net worth individuals and foundations, through to institutional investors such as NGS Super and Grosvenor Pirie Super.
Other roles Financial Intermediary – Social Ventures Australia
Maximum loss and return for investors Termination rights limit downside loss to approximately 40% of principal. Returns are 2% pa fixed interest payments over 4.75 years, then performance coupons based on the level of Resolve SBB Trust assets to a maximum of 11% per annum IRR over the 7.75 years.
Payment schedule and thresholds
Performance scenario Underperform Below target Target Above target Outperform
NWAU reduction 10% 17.5% 25% 32.5% 40%
IRR (pa) 4% 7.5% 10% 11%
Investor payment dates 31 March 2019 (final coupon 31 March 2025)

Sources and references:

http://www.socialventures.com.au/work/resolve-sbb

http://osii.nsw.gov.au/news/2017/05/05/resolve-social-benefit-bond-australian-first-social-impact-investment-to-improve-mental-health-outcomes/

Resolve SBB Information Memorandum (PDF, 1MB)

Resolve SBB Deed Poll and Purchase Deed (PDF, 1MB)

http://www.socialventures.com.au/news/sva-raises-7m-private-capital-australias-first-social-impact-bond-targeting-mental-health-outcomes/

Back to list of SIBs

South Australia

Aspire Social Impact Bond

Location Adelaide metro
Service start date 1 July 2017
Duration 7.75 year bond term.
Social Issue Homelessness
Target population Approximately 600 individuals will be referred to the Aspire Program from across Adelaide over a four year period. 400 of those referred are expected to meaningfully engage in the program. Referrals will be accepted from providers of homelessness services, participating prisons (up to 10% of referrals), participating hospitals (up to 10% of referrals) and Housing SA.
Outcome metric Use of health services (hospital bed days), justice services (convictions) and homelessness services (short term and emergency accommodation periods)
Outcome evaluation method Health, justice and homelessness service use compared to historical baseline
Intervention Based on the ‘housing first’ intervention model, with a focus on strengthening community engagement and employment participation. Participants will be provided stable accommodation, job readiness training, pathways to employment and life skills development. They will also have the long term support of a dedicated ‘Navigator’ to help them connect with wider support services and identify and achieve their aspirations.
Service Providers Hutt St Centre, an Adelaide based homelessness services specialist, in partnership with community housing providers including Housing Choices SA (formerly Common Ground Adelaide) and Unity Housing.
Outcome Funder Government of South Australia
Upfront capital commitment (by investors) $9m (total Government payments if target is met $17m; possible range is $6m to $21m)
Investors 65 investors including NGS Super, Future Super and HESTA, Coopers Brewery Foundation
Other roles Financial intermediary: Social Ventures Australia
Maximum loss and return for investors Returns are via 2% pa fixed interest payments over 4.75 years, then a performance coupon is paid that could take the IRR of the SBB to a maximum of 13% over 7.75 years. The maximum potential loss of Principal is approximately 50% due to termination rights.
Payment schedule and thresholds
Performance scenario Underperform Below target Target Above target Outperform
Hospital bed days reduction 5% 10% 15% 20% 25%
Convictions reduction 5% 10% 15% 20% 25%
Accommodation periods reduction 15% 40% 50% 60% 67%
IRR termination 4.5% 8.5% 12% 13%
Investor payment dates Payments calculated annually 31 December 2018 -2024

References: https://probonoaustralia.com.au/news/2017/03/homelessness-social-impact-bond-raises-9m/

http://www.socialventures.com.au/work/newpin-qld-sbb/

Aspire SIB Information Memorandum (PDF, 2MB)

Aspire SIB Deed Poll, Purchase Deed and Note Issue Supplement (PDF, 993KB)

Back to list of SIBs

Queensland

Information on Queensland SBBs is published by the Queensland Government here https://www.treasury.qld.gov.au/growing-queensland/social-benefit-bonds-pilot-program/

Newpin Queensland SBB

Location Cairns and two other locations in Queensland
Service start date Beginning 2018
Duration 7.25 years
Social Issue The over-representation of Aboriginal and Torres Strait Islander children in out-of-home-care
Target population Approximately 200 primarily Aboriginal and Torres Strait Islander families who have at least one child aged under five and a half years old and is in OOHC
Outcome metric The number of children in the Intervention Group that have been, and continue to be, reunified with their parent(s) [from out of home care] 18 months after their referral to the Newpin Program, less the Counterfactual Reunifications
Outcome evaluation method Comparison against historical baseline
Intervention Parents attend Newpin centres at least two days a week over 18 months. In this time, they are supported to develop their parenting skills, attend therapeutic support groups and interact meaningfully with their children.
Service Provider UnitingCare Queensland
Outcome Funder Queensland Government
Upfront capital commitment (by investors) $6m (total expected Government payments $26.5m)
Investors 34 investors, including NGS Super, along with QIC and HESTA
Other roles Financial intermediary: Social Ventures Australia
Maximum loss and return for investors Returns are via 2% pa fixed interest payments over six years, with a performance interest payment in year 7 that could take the IRR of the SBB to a maximum of 12% over 7.25 years. The maximum potential loss of Principal is 12% during the first three years and 50% thereafter.
Payment schedule and thresholds
Performance scenario Underperform Below target Target Above target Outperform
Rate of reunification 21.5% 31.5% 41.5% 51.5% 61.5%
Incremental reunifications 30 87 139 188 234
IRR (pa) -7% 3.5% 7.5% 10.5% 12%
Principal returned 50% 100% 100% 100% 100%
Investor payment dates 30 September each year from 2018 to 2024

References: https://s3.treasury.qld.gov.au/files/sbb-newpin-qld-fact-sheet.pdf

https://s3.treasury.qld.gov.au/files/sbb-update-march-2017.pdf

http://www.socialventures.com.au/work/newpin-qld-sbb/

Newpin Qld SBB Information Memorandum (PDF, 2MB)

Newpin Qld SBB Deed Poll and Purchase Deed (PDF, 1MB)

Back to list of SIBs

Youth Choices

The Queensland Government has signed a contract with Life Without Barriers for this SBB. Funds have not yet been raised.

Location Two locations – one in North Brisbane and the second in South Brisbane.
Service start date Expected start date late 2017
Social Issue Reducing offending rates for Young Queenslanders
Target population Up to 600 young people, 10-16 years old, who have been determined to have ‘high to very high’ risk of reoffending will be referred to the program by Youth Justice over five years.
Intervention Multi-Systemic-Therapy – will work with the family unit to deliver improved family functioning and parenting skills, higher rates of school participation and reduce substance abuse.
Service Provider Life Without Barriers
Outcome Funder Queensland Government
Other roles Financial intermediary: National Australia Bank (NAB)

References: https://s3.treasury.qld.gov.au/files/sbb-update-may-2017.pdf

Back to list of SIBs

YouthCONNECT SBB

The Queensland Government has signed a contract with Churches of Christ in Queensland for this SBB. Funds have not yet been raised.

Location Two services – one in South East Queensland and the other in Townsville.
Service start date Expected late 2017
Social Issue Homelessness for young people
Target population Young people aged 15 to 25  who are exiting or have exited statutory care and are homeless or are at risk of homelessness
Service Provider Churches of Christ in Queensland
Outcome Funder Queensland Government
Other roles Intermediary (raising and managing investment, program design and negotiations): Social Outcomes, in conjunction with Westpac

Back to list of SIBs

Victoria

Two contsortia, led by Anglicare and Sacred Heart Mission, have been selected to jointly develop social impact bonds with the Victorian Government. Service contracts have not yet been signed.

  1. The Anglicare consortium, which includes VincentCare, proposes a mix of individualised case management, specialist support, and stable housing to improve outcomes for young people leaving out of home care.
  2. Sacred Heart Mission will provide rapid access to stable housing and intensive case management to support Victorians experiencing chronic homelessness and harmful alcohol and other drug use.

http://www.premier.vic.gov.au/first-social-impact-bonds-for-disadvantaged-victorians/

Back to list of SIBs

I am more than happy to be corrected on any of the above – please email with changes that should be made, or or comment with differences of opinion or relevant information.

What limits the spread of SIBs?

I once played a game with a fellow SIB colleague where we challenged each other to ‘SIB this!’; to come up with a theoretical SIB contract for random government services. If you get really creative, it’s hard to think of something a government couldn’t purchase using a SIB. But the major difference between this game and the reality of government is that a landscape of services already exist. SIBs so far have only been implemented in service gaps. And this is one of the limitations of the SIB expansion – it’s hard to find service gaps to insert a whole new service into, and then define it cleanly enough to satisfy the parties to a SIB.

Why do we use SIBs for service gaps?

  • SIBs have largely been new prevention or early intervention services. They attempt to prevent or reduce people’s need for expensive existing services down the line. This is also the economic justification for SIBs – spend earlier to save later and help participants avoid worsening outcomes. So SIBs have been new services that try to reduce the need for existing services.
  • For SIBs that measure improvement, the comparison is ‘no service’. (When I say ‘no service, I don’t mean that all other services are withheld, most participants will still engage in a range of services.)

SIBs for existing contracts.png

Could SIBs spread to replace existing contracts?

Let’s examine this questions by splitting SIBs into two types (see the diagram above). The first is the type that pay for things that happen, without requiring evidence of improvement. For example per graduation, per job commencement, per child placed with a family. SIBs that look like this have been contracted by UK Department of Work and Pensions Innovation Fund for disadvantaged young people; It’s All About Me for adoption; Manchester City for children in care; Granite School District for early childhood education; Saskatchewan for single mothers.

cohort-sibs
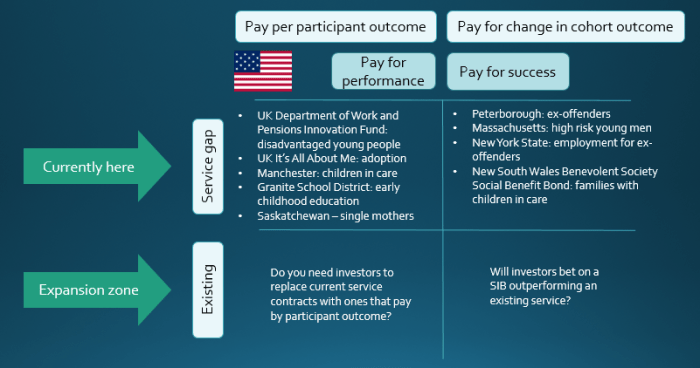
So could a pay-per-participant-outcome SIB replace an existing contract?

The second type of SIB pays for improvement against what might have happened without the service (a comparison or counterfactual). It seems that when people say ‘Pay for Success’ in the US, this is what they are referring to. The first SIBs in the UK and US, Peterborough and Massachusetts, were set up like this. These SIBs allow people to say that if there is no improvement in outcomes, then government does not need to pay. And Rikers Island is a good example of this happening.

Theoretically yes. And it seems that most governments are looking to replace at least some of their existing contracts with outcome-based contracts. And this looks like the direction that those involved in SIBs are heading. The Harvard SIB Lab is now called the Government Performance Lab. The Centre for Social Impact Bonds is partnering with Oxford University to create the Government Outcomes Lab. But would these contracts include the social investment that would make them SIBs? In a SIB, investment is usually sought to cover the working capital gap until outcome payments are made. But if government is paying per participant outcome, there isn’t much of a working capital gap, so there isn’t much need for investment.

Could a pay-per-improvement SIB replace an existing contract?

Again, the answer on theoretical grounds is yes. But payments in this model are made when the SIB improves on a comparison. And where this comparison is ‘no service’ in SIBs so far, now the SIB is going to have to improve on an existing service. And I don’t think you’d find an investor willing to bet that the ‘business rigour’ they bring to the table is going to measurably improve on the services delivered by that 150 yr-old charity down the road.

Summary

I don’t think we’re going to see SIBs spread to take over existing service contracts (please let me know if I’m wrong)! So we’ll continue to see each commissioner/government limited to a few only. But what will spread is the learning – what we have seen in Australia is that lessons from SIBs in a service gap changed the way billions of dollars of existing services were procured.

What if government doesn’t refer enough people into your social impact bond (SIB)?

One of the problems faced when developing a SIB is how people end up as part of the intervention cohort. If the process involves government or some other body referring participants to the service delivery organisation, how does this service delivery organisation manage the risk that not enough people will be referred, or that the wrong kind of people (i.e. those with little potential for change) will be referred?

Referral mechanisms that are used can be split into the following three categories:

  1. Eligible: eligibility criteria are defined and everyone who meets it is considered part of the SIB
  2. Self-selected: either the delivery organisation chooses participants or people choose to join
  3. Referred: government refers individuals into the program

All of these mechanisms involve some eligibility criteria that participants must meet to be included.

Examples of each mechanism are listed below.

Eligibility – everybody eligible is considered part of the intervention cohort and measured

Peterborough: All male prisoners exiting HMP Peterborough after serving less than 12 months sentence.

Other examples: New York City, New York State

One of the key benefits to government of this approach, is that the responsibility and incentive for convincing people to participate in the program lies with the service provider. It is also more suitable for a rigorous measurement approach where the intervention cohort is compared to another cohort, as the potential for bias in the selection process is reduced.

Self-selection – either the service delivery organisation chooses people to be part of their program or participants choose to join, usually with some eligibility criteria that must be met

DWP Innovation Fund: Service delivery organisations were asked to propose which young people they would work with and how they would attract them. “Your proposal must clearly demonstrate how you are identifying and working with the most disadvantaged and socially excluded young people, the vast majority of whom would otherwise not achieve educational and employment outcomes” (DWP, Round Two Specifications). Some programs asked schools or other organisations to refer students to them.

One of the key benefits of this approach is that the service delivery organisation is in control of how many participants are included in the program, so if they need more people they can do something about it themselves. They can also make sure that the participants have the type of needs that their program was designed for.

Referred – Government refers people it consider suitable for the program, usually using some eligibility or referral criteria

Australia The Benevolent Society: Referrals are made by the Department of Family and Community Services according to the processes and criteria set out in an operations manual.

Other examples: Essex County Council, Australia Newpin

This referral system is sometimes preferred by government, as it gives them control over who participates in the program, but it means that providers are exposed to the risk that not enough people are referred.

But how do we make sure enough participants are referred to a SIB?

Let’s look at two SIBs where this issue has been responded to.

Educating/marketing to government referrers: Essex County Council

The Essex County Council SIB relied on referrals from the council, however they weren’t getting enough of the right type. In order to fix this, the delivery organisation went in to educate and encourage council staff about the program and who they should refer to it.

“We discovered that Essex weren’t referring enough children who would most benefit from the intervention, due to a combination of things, including competing priorities of senior staff and referral staff not knowing the program existed, or who and how to refer. Solving this problem would not usually fall in the remit of a service provider, but our performance managers went into the council to do a marketing push and went right up to a senior level to change the way they were referring.  The board is also considering whether to add an additional ‘marketing’ function to the service, to ensure that the barriers to referral are continually being addressed proactively” (Andrew Levitt, of Bridges Ventures, deliveringthepromise.org).

Incentives for government to refer (or penalties if they don’t): The Benevolent Society

The Australian Social Benefit Bond delivered by the Benevolent Society has a second part to its payment formula that corrects for a lack of referrals. The first part is related to the improvement that the program makes against its three outcome metrics: Out-of-home care entries; Safety and Risk Assessments; Helpline Reports. The second part is where the improvement is adjusted according to whether adequate referrals have been made and whether the children in the program can be compared against children not in the program. It’s called the ‘Performance percentage’.

While payments will not be made until 2018, we can use the 2014 preliminary results to understand how the metric works.

IMPROVEMENT PERCENTAGE
Measure Improvement Weighting
Out-of-home care entries 17% 66%
Safety and Risk Assessments (70%) 17%
Helpline Reports (3%) 17%
Improvement Percentage (1%)

In 2014, the program made a minus one percent improvement against its outcomes.

The second part of the payment metric combines the improvement percentage with two metrics that address the risk related to (1) the measurement and (2) the referral methods.

  1. The counterfactual for this program is a propensity-score-matched control group, so to manage the risk of children not being able to be matched, a fixed improvement of 15% is assigned to each unmatched child.
  2. The SIB has set a number of children the Department of Family and Children’s Services guarantees to refer. For each child under the guaranteed number, an improvement of 40% is assigned. You can see below that in the first year of the program, referrals from government were 21% below where they should be, which combined with the score for unmatched children, lifted the performance percentage from -1% to 8%. This is a huge incentive for the Department to make sure they are meeting their referral guarantee.
PERFORMANCE PERCENTAGE
Measure Performance Weighting
Improvement Percentage (1%) 77%
Unmatched Children Percentage 15% (fixed) 2%
Guaranteed Referrals Shortfall Percentage 40% (fixed) 21%
Performance Percentage 8%

So the 2014 results carried a huge penalty for government falling short in referrals.

Interestingly enough, the 2015 results show the Guaranteed Referrals still falling short by 13%. This could be due to over-calculation of eligible families during the contract development, or it could indicate a continuing lack of referrals by government staff to the program. It will be interesting to watch how this mechanism works as we head towards payment in 2018.

What do we know about the Utah SIB results (without a counterfactual)?

The Utah SIB recently paid a return for Goldman Sachs, and press releases from both Goldman Sachs and United Way of Salt Lake deemed the program a success. But this was met with some criticism, most notably by the New York Times in Nathaniel Popper’s article Success Metrics Questioned in School Program Funded by Goldman. Now I would argue that success for each stakeholder is achieving whatever they wanted to achieve. So as far as I’m concerned, claiming success simply means that things happened as you wanted. But we might also assume that a government’s objectives are what it’s prepared to pay for via the SIB payment metric.

So how does the payment metric for the Utah SIB work?

For the first year results, Goldman Sachs was paid 95% of the savings to the state. Savings to the state are calculated from the number of children identified as ‘likely to use special education in grade school’[i] (110 in year 1) minus the number of children who used special education (1 in kindergarten) multiplied by the cost of a special education add-on for one year ($2607).

Is that a success?

Well, the program is doing very well at delivering on its payment metric. Of the 110 children identified as likely to use special education, only one of them is using special education in kindergarten. If this is the definition of success, then the program is definitely a success!

Utah 1

(United Way (2015) SIB fact sheet)

So what’s the problem?

Many people who aren’t involved in the SIB would define success a little differently to the payment metric. They would define the success of the program by the reduction in how many children would require special education support. What we don’t know is how many of the 110 children would have needed special education without the program. I teach my probability classes that ‘likely’ means 50%-80%. But the payment metric seems to assume that 100% of the children would have needed special education without the program, according to the savings-to-government calculation. In order to know how much the program improved things for the children involved, we need a comparison group or ‘counterfactual’, an estimate of how many of the children would have ended up using special education. A counterfactual means you can claim you caused the results, the absence of a counterfactual means you can only say you contributed to them.

What’s a counterfactual?

A counterfactual or comparison group can be constructed in several ways. “A good comparison group is as similar as possible to the group of service users who are receiving an intervention, thus allowing you to be confident that the difference in outcomes between the groups is only caused by the intervention.”[ii] Some of the more commonly used counterfactuals in SIBs are shown below.

Utah 2

If you would like to know more, I recommend this Guide to Using Comparison Group Approaches from NPC and Clinks in the UK. And for guidance on randomised control trials in public policy setting you can’t go past the UK Cabinet Office’s Test, Learn, Adapt.

The Utah SIB involved no comparison group – certainly the payment metric didn’t.

So without a counterfactual, what can we say about this SIB?

  • “Of the 110 four-year-olds had been previously identified as likely to use special education in grade school…only one went on to use special education services in kindergarten.”[iii]
  • “These results triggered the first payment to investors for any SIB in the United States.”[iv]
  • “As a result of entering kindergarten better prepared, fewer children are expected to use special education and remedial services in kindergarten through 12th grade, which results in cost savings for school districts, the state of Utah and other government entities.”[v] [note this says ‘fewer children are expected to use’, not ‘fewer children use’]
  • “109 of 110 At-Risk Utah Students Avoid Special Education Services Following High-quality Preschool”[vi] [this would be untrue if the word ‘following’ was changed to ‘due to’ or ‘because of’]
  • “Utah’s [curriculum and testing] methodology was vetted both locally and nationally by early education and special education experts and leaders”[vii]
  • “They lacked certain basic data on what would have been expected to have happened to the students without the Goldman-funded preschool”[viii]
  • “My kids have really grown. I don’t think [my kids] would be where they are if it wasn’t for the preschool. That basic step is what prepares you to succeed in school, and later, in life.”[ix]

What can’t we say?

  • “School districts and government entities saved $281,550 in a single year, based on a state resource special education add-on of $2,607 per child.”[x][we have no idea what they would have spent on this group otherwise]
  • “High-quality preschool changes the odds”[xi][we simply don’t know what the odds would have been without the preschool program, so we can’t say that they’ve changed]
  • “Fewer children used special education services and remedial services by attending the SIB-financed Preschool Program, saving money for school districts and government entities”[xii]

What other SIBs don’t have a counterfactual?

  • UK: ten DWP Innovation Fund programs (seven of which were SIBs) [the Impetus-PEF ThinkForward SIB press release shows similar difficulty to the Utah SIB in understanding the difference made to young people. While 90% of young people engaged in further education, employment or training seems a wonderful result, there is no estimate of what might have happened otherwise.]
  • UK: seven Fair Chance Fund SIBs
  • UK: four Youth Engagement Fund SIBs
  • UK: Manchester Children in Care
  • UK: It’s All About Me – Adoption SIB
  • Canada: Saskatchewan single mothers’ SIB
  • Australia: Newpin SIB (for the first three years while a control group is established)

Note that most government spending on social services is not compared to a counterfactual. Some people argue that the perceived requirement for a SIB counterfactual creates an unnecessary additional barrier to SIB development, but others argue that it’s the best thing about SIBs – for the first time we are having mainstream discussions about standards of measurement and evidence in social services.

If you know of any government-funded social programs other than SIBs that do have a counterfactual, please post a link to them in the comment box below.

Why doesn’t every SIB have a counterfactual?

  • In order to estimate the effect of an intervention with any confidence, you need a large sample size. This is called ‘statistical power’ – I’ve tried to explain it in SIB Knowledge Box: Statistical Power. If a program is working intensively with just a few people, as is the case in Saskatchewan (22 children in SIB), then a reliable comparison to a counterfactual is not possible.
  • It is more work to set up a counterfactual – a similar comparison group must be established and this can take varying degrees of effort. It also takes skill that is in short supply. Biostatisticians are one of the the best resources for this kind of work. Most government stats units do not have experience in this kind of work.
  • Without a counterfactual, results can be counted as they are achieved, rather than waiting for a statistical comparison for the group, so investors can get paid earlier and more frequently and managers can ‘track’ performance.

As always, if there’s anything in this article that needs correcting or information that should be included, please either comment below or use the contact page to send me an email.


[i] United Way (2015) SIB fact sheet

[ii] NPC & Clinks (2014) Using comparison group approaches to understand impact

[iii] Edmondson, Crim, & Grossman (2015) Pay-For-Success is Working in Utah, Stanford Social Innovation Review

[iv] Edmondson, Crim, & Grossman (2015) Pay-For-Success is Working in Utah, Stanford Social Innovation Review

[v] United Way of Salt Lake 2015, Social Impact Bond for Early Childhood Education Shows Success

[vi] United Way of Salt Lake 2015, Social Impact Bond for Early Childhood Education Shows Success

[vii] Bill Crim, 2015, When Solid Data Leads to Action – Kids’ Lives Improve

[viii] Nathaniel Popper, 2015, Success Metrics Questioned in School Program Funded by Goldman

[ix] United Way (2015) SIB fact sheet

[x] Edmondson, Crim, & Grossman (2015) Pay-For-Success is Working in Utah, Stanford Social Innovation Review

[xi] United Way (2015) SIB fact sheet

[xii] United Way (2015) SIB fact sheet

Rikers Island social impact bond (SIB) – Success or failure?

There’s been a lot of discussion over tRikershe past few weeks as to whether Rikers Island was a success or failure and what that means for the SIB ‘market’. You can read the Huffington Post learning and analyses from investors and the Urban Institute as to the benefits and challenges of this SIB. But I think the success and failure discussion fails to recognise the differences in objectives and approaches between SIBs. So I’d like to elaborate on one of these differences, and that’s the attitude towards continuous adaptation of the service delivery model. Some SIBs are established to test whether a well-defined program will work with a particular population. Some SIBs are established to develop a service delivery model – to meet the needs of a particular population as they are discovered.

1.     Testing an evidence-based service-delivery model

This is where a service delivery model is rigorously tested to establish whether it delivers outcomes to this particular population under these particular conditions, funded in this particular way. These models are often referred to as ‘evidence-based programs’ that have been rigorously evaluated. The US is further ahead than other countries in the evaluation of social programs, so while these ‘proven’ programs are still in the minority, there are more of them in the US than elsewhere. These SIBs are part of a movement to support and scale programs that have proven effective. They are also part of a drive to more rigorously evaluate social programs, which has resulted in some evaluators attempting to keep all variables constant throughout service delivery.

An evidence-based service delivery model might:

  • be used to test whether a service delivery model that worked with one population will work with another;
  • be implemented faithfully and adhered to;
  • change very little over time, in fact effort may be made to keep all variables constant e.g. prescribing the service delivery model in the contract;
  • have a measurement focus that answers the question ‘was this service model effective with this population’?

“SIBs are a tool to scale proven social interventions. SIBs could fill a critical void: other than market-based approaches, a structured and replicable model for scaling proven solutions has not existed previously. SIBs can give structure to the critical handoff between philanthropy (the risk capital of social innovation) and government (the scale-up capital of social innovation) to bring evidence-based interventions to more people.” (McKinsey (2012) From potential to action: Bringing social impact bonds to the US, p.7).

2.    Developing a service delivery model

This is where you do whatever it takes to deliver outcomes, so that the service is constantly evolving. It may include an evidence-based prescriptive service model or a combination of several well evidenced components, but is expected to be continuously tested and adjusted. It may be coupled with a flexible budget (e.g. Peterborough and Essex) to pay for variations and additions services that were not initially foreseen. This approach is more prevalent in the UK.

A continuously adjusted service delivery model might:

  • be used to deliver services to populations that have previously not received services, to see whether outcomes could be improved;
  • involve every element of service delivery being continuously analysed and refined in order to achieve better outcomes;
  • continuously evolve – the program keeps adapting to need as needs are uncovered;
  • have a measurement focus that answers the question ‘were outcomes changed for this population’?

Andrew Levitt of Bridges Ventures, the biggest investor in SIBs in the UK, “There is no such thing as a proven intervention. Every intervention can be better and can fail if it’s not implemented properly –it’s so harmful to start with the assumption that it can’t get better.” (Tomkinson (2015) Delivering the Promise of Social Outcomes: The Role of the Performance Analyst p.18)

Different horses for different courses

Rikers New York City

The New York City SIB was designed to test whether the Adolescent Behavioral Learning Experience (ABLE) program would reduce the reoffending of the young offenders exiting Rikers Island. Fidelity to the designated service delivery model was prioritised, in order to obtain robust evidence of whether this particular program was effective. WYNC News reported that “Susan Gottesfeld of the Osborne Association, the group that worked with the teens, said teens needed more services – like mental health care, drug treatment and housing assistance – once they left the jail and were living back in their neighbourhoods.”

In a July 28 New York Times article by Eduardo Porter, Elizabeth Gaynes, Chief Executive of the Osborne Association is quoted as saying “All they were testing is whether M.R.T. by itself would make a difference, not whether something you could do in a jail would make a difference,” Ms. Gaynes said. “Even if we could have raised money to do other stuff, we were not allowed to because we were testing M.R.T. alone.”

This is in stark contrast with the approach taken in the Peterborough SIB. Their performance management approach was a continuous process of identifying these additional needs and procuring services to meet them. The Peterborough SIB involved many adjustments to its service over the course of delivery. For example, mental health support was added, providers changed, a decision was made to meet all prisoners at the gate… as needs were identified, the model was adjusted to respond. (For more detail, see Learning as They Go p.22, Nicholls, A., and Tomkinson, E. (2013). Case Study: The Peterborough Pilot Social Impact Bond. Oxford: Saïd Business School, University of Oxford.)

Neither approach is necessarily right or wrong, but we should avoid painting one SIB a success or failure according to the objectives and approach of another. What I’d like to see is a question for each SIB: ‘What is it you’re trying to learn/test?’ It won’t be the same for every SIB, but making this clear from the start allows for analysis at the end that reflects that learning and moves us forward. As each program finishes, let’s not waste time on ‘Success or failure?’, let’s get stuck into: ‘So what? Now what?’

Huge thanks to Alisa Helbitz and Steve Goldberg for their brilliant and constructive feedback on this blog.

Changing a Social Impact Bond (SIB) metric mid-flight

Social impact bonds are new, so involve a lot of learning on the job. This learning is less that one SIB ‘works’ and another SIB does not, but more about the iterative adjustments that allow for more effective services, more flexible procurement processes, more alignment of incentives in contracts. One aspect of SIBs that is new for many jurisdictions is long-term contracts. Long-term contracts have many benefits to those delivering and receiving services, but in order to respond to information that comes to light over this time, they must also allow for adjustment and termination.

As its second year draws to a close, investors in Australia’s first social impact bond, the Newpin Social Benefit Bond, have been asked to approve an amendment to its payment metrics, so that they more faithfully reflect success for the children and families it serves.

The reason for this is that the metric rewards investors when children in foster care are restored to their families by the court (“restorations”). When developing the metrics, the breakdown of restorations where children would return to foster care (“reversals”) was discussed, but failed to be written into the contracts. The intention of the metrics is to reward social outcomes with financial return, which means that while restorations should result in payments, reversals should not.

The Newpin Social Benefit Bond has two different payment metrics. One that determines payment from government to the delivery charity, UnitingCare, and a different one metric to determine payment from UnitingCare to Investors.

Newpin SBB payment metrics

The problem with each metric and the amendments proposed to rectify these problems are shown below. For original contracts and a more detailed summary of metrics see the bottom of this page.

What is the problem?

  • Metric 1 NSW Government => UnitingCare: a drafting error was made that did not deduct reversals in the current measurement period, only previous measurement periods. So the government does not make payments for reversals that occurred in the previous financial years, but does make payments for reversals in the most recent financial year.
  • Metric 2 UnitingCare => investors: UnitingCare makes payments based on the cumulative rate of restoration of children to their families. This includes restorations that have been reversed and thus does not faithfully reflect success for families.

In the second year of the SIB, several reversals occurred. So all parties wanted to ensure that these were not paid for in the same way as successful restorations. Government and UnitingCare agreed to amend their metric (Metric 1). An amendment to the investor metric (Metric 2) was also sought to limit payments for unsuccessful restorations. In order to change the metrics, all 60-odd investors had to agree to it. They were also given the option of selling their investment. Using the results to the end of May 2015, the amended metric would return 7.5% interest to investors for the year, while the original contract would return 13.5% interest for the year. If investors did not agree to the amendment UnitingCare would have to pay the inflated interest and continue the service with an imbalance between payments from government and the interest paid to investors. This may have led to UnitingCare exercising their termination rights at the end of year 3. A 10% cap on reversals was proposed in order to limit the ongoing risk to investors and increase the likelihood that they would agree to the amendment.

The proposed amendment

  • Metric 1 NSW Government => UnitingCare: change to not paying for reversals that occur within 12 months of a restoration.
  • Metric 2 UnitingCare => investors: change to not paying for reversals that occur within 12 months of a restoration, but only up to a cap of 10% of restorations. If more than 10% of restorations are reversed, then reversals over this cap are treated as successful restorations for the purpose of calculating the interest paid by UnitingCare to investors.

The amendment still leaves us with an imperfect metric.

  1. If the proportion of reversals is above 10%, UnitingCare will make interest payments to investors (based on the cumulative restoration rate) which will include restorations that have been reversed, even though this does not reflect success for the families involved.
  2. If the proportion of reversals is above 10%, UnitingCare will make a success payment to investors that includes reversals over the cap, but for these reversals, UnitingCare will not receive government outcome payments.
  3. There were no reversals in the first year of the SBB and 28 children were restored from the mothers’ centres. In the second year to May 2015 (not a full year), 20 children were restored from the mothers’ centres, and 7 of these restorations were reversed, some being reversals of restorations from the previous year. The reversals at the mothers’ centres represent 15% of cumulative restorations. Therefore reversals for the second year are above 10% of restorations. If the amendment is agreed and applied retrospectively to year two, UnitingCare will pay investors for restorations that were not maintained, and for which they themselves receive no payments.

What can we learn?

There are several key lessons I draw from this experience. Note that every other stakeholder may have a completely different list!

  1. It’s important to be able to learn as you go and respond to new information, allowing for amendments, dispute and termination on fair terms.
  2. Having different metrics determining payments to the delivery agency and payments from the delivery agency means that there is some misalignment of incentives.
  3. The Newpin SBB has a mix of ‘impact-first’ and ‘finance-first’ investors. The 10% cap was a way of striking a balance between them. While the fiduciary duties of those investing through structures such as self-managed super funds and Private Ancillary Funds do not conflict with them making social/impact investments, some perceived agreeing to a lower rate of return as conflicting with their fiduciary duties as trustees.
  4. When contracting for outcomes, enormous attention has to be paid to thinking through all potential scenarios, however unlikely, to ensure the intended social outcomes are reflected in the legal terms.
  5. It is very difficult to reflect the journey of someone through social service systems with a binary measure. The definitions and metrics deem the program as either successful or unsuccessful for children and their families, with no ability to accommodate degrees of success or episodes of care over time.

Update on results to July 2015 (2.25 years of service delivery and second payment to investors)

The amendment was passed by all investors. Without the amendment, the Restoration Rate would have been calculated at 68% and the Interest Rate at 15.08%. With the amendment, the Restoration Rate was calculated at 62% and the Interest Rate paid to investors was 8.92%. If there had been no cap, and all reversals were considered unsuccessful outcomes, the Restoration Rate would have been calculated at 58% and the Interest Rate would have been 5.6%. So the investors did agree to forgo much of the interest that was due to them under the original agreement, but gained over 3% more than if all reversals were treated as unsuccessful outcomes. The difference in the investor interest was paid by the charity UnitingCare. The amount they were paid by NSW Government paid was not affected by this.

Newpin SBB metric - year 2

References

Metrics summary

  • Metric 1 NSW Government => UnitingCare: for Cohort 1 Outcome Payment = (the total number of restorations for all Mothers’ Centres and Fathers’ Centres – the counterfactual restorations) x the amount in payments look-up table. The counterfactual restorations are set at 25% for the first three years and then by a live control group. There are also payments that do not depend on outcomes and outcome payments for other cohorts.
  • Metric 2 UnitingCare => investors: Interest Rate = 3% + [0.9 x number of restorations for all Mothers’ Centres/(number of referrals to Mothers’ Centres– 55%)] subject to:
    • if the Restoration Rate is below 55%, the Interest Rate is nil; except
    • a minimum of 5% is applied over the first three years; and
    • a maximum of 15%.

*Note that investor payments relate only to Mothers’ Centres as they were considered lower risk at the time the metric was developed. The discussion above focuses on Mothers’ Centres only.

Disclaimer: Emma is a retail investor in the Newpin Social Benefit Bond. She bought her parcel from a wholesale investor when the restrictions around types of investors expired. She firmly believes that Newpin does wonderful and important work with families.  

When is a social impact bond (SIB) not a SIB? Should we care?

SIB pic

There are advantages and disadvantages to the term ‘social impact bond’ (SIB).

From the time it was coined it has caused confusion. The word ‘bond’ implies that capital is guaranteed, that interest is fixed, and that cash flows for the principal occur at the beginning and end, with ‘coupon’ or interest paid in the interim. Some SIBs are like this, particularly in the US. But some are a set of contracts and cash flows that bear almost no similarity to a bond at all. So should it be called something else? The Peterborough contract actually uses the words ‘Social Impact Partnership’, a phrase also chosen for the Western Australian paper on SIBs. But the word ‘bond’ has attracted more interest from the financial sector than ‘partnership’ might have, an observation I first heard expressed by Social Finance’s Toby Eccles. In Australia, the bulk of media on SIBs has occurred in the Australian Financial Review, which has loved ‘bonds’, but may have been more inclined to put stories about ‘partnerships’ in its sister publications for general news.

To figure out what is a SIB and what’s not a SIB, I use the definition we came up with at the Cabinet Office:

The Centre for Social Impact Bonds defines a Social Impact Bond (SIB) as an arrangement with four necessary features:

  • a contract between a commissioner and a legally separate entity ‘the delivery agency’;
  • a particular social outcome or outcomes which, if achieved by the delivery agency, will activate a payment or payments from the commissioner;
  • at least one investor that is a legally separate entity from the delivery agency and the commissioner; and
  • some or all of the financial risk of non-delivery of outcomes sits with the investor.

More recently, however, I’m seeing the words ‘social impact bonds’ and ‘social investment bonds’ refer to financial instruments that look much more like bonds. They borrow money at a fixed rate, use it to do something which generates some kind of income, and then pay the money back at the end. They don’t involve financial risk for the investor that is pegged to the non-delivery of social outcomes.

So is there a problem?

I like my world ordered, and it initially bothered me that a concept I define so tightly was being applied to something else. How are we to collect relevant literature on something if our key search terms are being used to refer to something else? Disaster! But then I remembered why social impact bonds interested me in the beginning: they interrogate and align the incentives of stakeholders in social programs. These other bonds showed innovative thinking about structuring finance to deliver social outcomes. That’s worth celebrating! Let’s put the definition aside and celebrate a few variations on the theme (NB: dates relate to announcements – most are still in development):

  1. Khazanah Nasional – social impact bond / social impact sukuk – Malaysia – April 2015

This issue is raising M$1bn (US$282m) and is rated AAA. It will fund a range of environmental and social projects, rather than just one. Instead of investors getting paid more when outcomes are achieved, this instrument pays less. “The Ihsan SRI sukuk incorporates a unique feature where the principal amount is reduced when the selected project hits certain key performance indicators. This means investors will not recover the original sum put in, although they will continue to enjoy an income from the annual distribution rates or coupons. That suggests annual returns will be key in driving demand.

  1. Richmond City (US) – social impact bonds – US – March 2015.

This is a proposal from the Richmond Community Foundation, but which Richmond City sells social impact bonds to raise money that the community foundation could use to buy homes. Local workers rehabilitate the homes, which will then be sold to people through first-time home buyer programs.  A sale of $3 million in bonds was expected in March 2015, pending final approval by the Richmond City Council. That would pay for the rehabilitation of 20 properties a year over five years.

  1. Instituto de Crédito Oficial (ICO) – social bonds – Spain – January 2015.

The funds raised from investors via the “social bonds” will distributed as loans to finance micro-businesses and SMEs. The bonds are rated and total 1 billion euros, with a term of 3 years and an annual coupon of 0.50%.

  1. IIX – Women’s Impact Bond – International – October 2014

The WIB will raise US$10 million, deployed as loans to a selected group of clean cook-stove-related businesses. The bond will have a maturity of 4 to 5 years. The WIB is a pooled fixed income security issued by a special purpose vehicle (SPV) created by IIX.

  1. Midlands Together and Bristol Together – bonds/social impact bonds – UK –July 2013

Triodos worked with Midlands Together to raise a £3m bond for a five-year term and offered investors an annual fixed return of 4 – 6 per cent secured against the company’s assets. This followed £1.6m of funding across two raises for Bristol Together, both in the form of a five year bond issue. The ‘Together’ model involves using the money raised from the bond to buy empty and sub-standard homes and works with social enterprise partners to employ ex-offenders in the repair, refurbishment and restoration. Once the properties are fully restored they are then sold and the original capital, plus any profits, re-invested back into the business and used to pay investors.

Other examples of Triodos Bond raises for environmental and social organisations are here.

Developing a counterfactual for a social impact bond (SIB)

The following was taken from a presentation by Sally Cowling, Director of Research, Innovation and Advocacy for UnitingCare Children, Young People and Families. The presentation was to the Social Impact Measurement Network of Australia (SIMNA) New South Wales chapter on March 11 2015. Sally was discussing the measurement aspects of the Newpin Social Benefit Bond, which is referred to as a social impact bond in this article for an international audience.

The social impact bond (called Social Benefit Bond in New South WaleSally Cowlings) was something very new for us. The Newpin (New Parent and Infant Network) program had been running for a decade supported by our own investment funding, and our staff were deeply committed to it. When our late CEO, Jane Woodruff, appointed me to our SIB team she said my role was to ’make sure this fancy financial thing doesn’t bugger Newpin up’.

One of the important steps in developing a social impact bond is to develop a counterfactual. This estimates what would have happened to the families and children involved in Newpin without the program, the ‘business as usual’ scenario. This was the hardest part of the SIB. The Newpin program works with families to become strong enough for their children to be restored to them from care. But the administrative data didn’t enable us to compare groups of potential Newpin families based on risk profiles to determine a probability of restoration to their families for children in care. We needed to do this to estimate the difference the program could make for families, and to assess the extent to which Newpin would realise government savings.

Experimenting with randomised control trials

NSW Family and Community Services (FACS) were keen to randomly allocate families to Newpin as an efficient means to compare family restoration and preservation outcomes for those who were in our program and those who weren’t. A randomised control trial is generally considered the ‘gold standard’ in the measurement of effect, so that’s where we started.

Child's drawing of a happy kidOne of my key lessons from my Newpin practice colleagues was the importance of their relationships and conversations with government child protection (FACS) staff when determining which families were ready for Newpin and had a genuine probability (much lower than 100%) of restoration. When random allocations were first flagged I thought ‘this will bugger stuff up’.

To the credit of FACS they were willing to run an experiment involving local Newpin Coordinators and their colleagues in child protection services. We created some basic Newpin eligibility criteria and FACS ran a list from their administrative data and randomly selected 40 families (all of whom were de-identified) for both sets of practitioners to consider. A key part of the experiment was for the FACS officer with access to the richer data in case files to add notes. Through these notes and conversations it was quickly clear that a lot of mothers and fathers on the list weren’t ready for Newpin because:

  • One was living in south America
  • A couple had moved interstate
  • One was in prison
  • One had subsequent children who had been placed into care
  • One was co-resident with a violent and abusive partner – a circumstance that needed to be addressed before they could commence Newpin

From memory, somewhere between 15 and 20 percent of our automated would-be-referrals would have been a good fit for the program. It was enlightening to be one of the non-practitioners in the room listening to specialists exchange informed, thoughtful views about who Newpin could have a serious chance at working for. This experiment was a ‘light bulb moment’ for all of us. For both the government and our SIB teams, randomisation was off the table. Not only was the data not fit for that purpose, we all recognised the importance of maintaining professional relationships.

In hindsight, I think the ‘experiment’ was also important to building the trust of our Newpin staff in our negotiating team. They saw an economist and accountant listening to their views and engaging in a process of testing. They saw that we weren’t prepared to trade off the fidelity and integrity of the NewpiChild's drawing of happinessn program to ‘get’ a SIB and that we were thinking ethically through all aspects of the program. We were a team and all members knew where they did and didn’t have expertise.

Ultimately Newpin is about relationships. Not just the relationships between our staff and the families they work with, but the relationship between our staff and government child protection workers.

But we still had the ‘counterfactual problem’! The joint development phase of the SIB – in which we had access to unpublished and de-identified government data under strict confidentiality provisions – convinced me that we didn’t have the administrative data needed to come up with what I had come to call the ‘frigging counterfactual’ (in my head the adjective was a bit sharper!). FACS suggested I come up with a way to ‘solve’ the problem and they would do their best to get me good proxy data. As the deadline was closing in, I remember a teary, pathetic midnight moment willing that US-style admin data had found a home in Australia.

Using historical data from case files

Eventually you have to stop moping and start working. I decided to go back to the last three years of case files for the Newpin program. Foster care research is clear that the best predictor of whether a child in the care system would be restored to their family was duration in care. We profiled all the children we had worked with, their duration in care prior to entry to Newpin and intervention length. FACS provided restoration and reversal rates in a matrix structure and matching allowed us to estimate that if we worked with the same group of families (that is, the same duration of care profiles) under the SIB that we had in the previous 3 years, then the counterfactual (the percentage of children who would be restored without a Newpin intervention) would be 25%.

As we negotiated the Newpin Social Benefit Bond contract with the NSW Government we did need to acknowledge that a SIB issue had never been put to the Australian investment market and we needed to provide some protection for investors. We negotiated a fixed counterfactual of 25% for the first three years of the SIB. That means that the Newpin social impact bond is valued and paid on the restoration rate we can achieve over 25%. Thus far, our guesses have been remarkably accurate. To the government’s immense credit, they are building a live control group that will act as the counterfactual after the first three years. This is very resource intensive but the government was determined to make the pilot process as robust as possible

In terms of practice culture, I can’t emphasise enough the importance of thinking ethically. We had to keep asking ourselves, ‘Does this financial structure create perverse incentives for our practice?’ The matched control group and tightly defined eligibility criteria remove incentives for ‘cherry picking’ (choosing easier cases). The restoration decisions that are central to the effectiveness of the program are made independently by the NSW Children’s Court and we need to be confident that children can remain safely at home. If a restoration breaks down within 12 months our performance payment for that result is returned to the government. For all of us involved in the Newpin Social Benefit Bond project behaving thoughtfully, ethically and protecting the integrity of the Newpin program has been our raison d’etre. That under the bond, the program is achieving better results for a much higher risk of group of families and spawning practice innovation is a source of joy which is true to our social justice ethos.

Unit costs – what do they mean?

unit costs

Both the G8 Social Impact Investment Taskforce report and Impact Investing Australia’s report to the G8 have called for publication of unit costs of government services, in order to encourage social innovation and social investment. The assumption behind this seems to be that:

  1. If people know the cost of delivering something, then
  2. They might develop a preventative social program that allows these costs to be avoided, which
  3. Saves the government money, and
  4. Delivers better social outcomes for the population.

Well this may be true for things like employment services, where the government saves cash by not paying unemployment benefits. But you might not get a lot of enthusiasm from some other parts of government. And that’s because a reduction in demand for government services doesn’t necessarily mean that government saves money. In order for this to happen, costs must be able to be recouped i.e. they must be marginal, reflecting the additional cost to the system of more people requiring more services. Marginal costs represent what can be saved if this government service isn’t required. So it all depends on how government spending currently occurs.

Let’s take a look at types of unit costs and how they are calculated. And then see what this means using the reoffending unit cost examples from the NSW Government’s Office of Social Impact Investment:

Unit cost How is it calculated NSW example  What does it mean? What’s it useful for?
Average operating cost Divide entire budget, (including the cost of things like the head of the department and their staff) by service units e.g. total nights spent in custody in one year It costs Corrective Services NSW $189 per day to keep an inmate in custody. Savings may result in response to reduced demand if a prison or wing of a prison closes, but only if staff are sacked and the prison is not maintained. Useful for governments to benchmark their costs against other governments or identify trends in their expenditure over time.
Cost of time and other items Work out how much time is spent on something and the salaries of the people spending that time. Add in any incidentals like photocopying, petrol, travel. It costs NSW Police $2,696 to finalise an offending event in court. This represents time that could be spent on other tasks- If the number of crimes drops, Police are more likely to reallocate their time, than be sacked. Time, rather than money, is saved. Useful for governments to analyse ways to better allocate human resources.
Capital expenditure Look at budget for new buildings in response to increasing demand. This was not a cost given by NSW Government, but new prisons can cost several hundred million. If demand can be reduced by a certain proportion and maintained for a certain period of time, a new prison may be avoided and the amount budgeted for it maybe saved. Useful for looking at long-term government budget allocations and thinking about the best ways to spend a given amount of money.
Marginal cost (sometimes referred to as cashable savings) The cost of things purchased specifically for one more unit of service  i.e. new trainers, toothbrush, appointments with psychologists, water for washing clothes, food for one more person. It costs Corrective Services NSW $19 per day for every additional inmate in custody Every time a unit of service is avoided, the government can avoid spending this much money. Useful for people outside government to understand their potential impact on government expenditure.

If we assumed that cash recovered from NSW marginal costs were used to fund preventative services, we would:

  • take the $19 per day marginal cost
  • multiply it by the 49% of unsupervised parolees that reoffend within 12 months[1]
  • multiply it by the average 1.8 proven offences they commit in within 12 months[2]
  • multiply it by the 31% of those proven offences that are sentenced to prison[3]
  • and multiply it by the 8 out of 12 months we expect these people to spend in prison from those sentencing (average sentence is 486 days[4] and average time of entry during 12 months post-release is around four months after release[5]).

Then we’d have $3.48 per person per day to spend on our services over the first 12 months. Not a lot.

This doesn’t mean that it’s not worth spending money on preventative services for people who are released from prison. It just means that we need to realise that this isn’t a ‘no brainer’ for government and that it’s a serious spending decision that has to be weighed up against other uses for the cash. It’s certainly not the hugely misleading [6] calculation put forward in the G8 Social Impact Investment Taskforce report:

“Say, for example, that a £10 million, five-year SIB for reducing recidivism delivers an 8% financial return and significant social impact by succeeding in rehabilitating 1,000 youth offenders, each of whom would have cost the UK government £21,268 a year. Using the Unit Cost Database gives a value for the social outcome in just the first year of £21 million, and an associated social return per annum of about 15% (internal rate of return) for the SIB” (p.16).

In order for unit costs to be useful, we need to be informative and realistic about what they represent. Marginal costs will reduce as demand falls. But people quoting average operating costs back to government as if they represent savings? Not so helpful.

[1] http://www.dpc.nsw.gov.au/__data/assets/pdf_file/0003/168339/Statement_of_Opportunities_2015_WEB.pdf p8

[2] http://www.dpc.nsw.gov.au/__data/assets/pdf_file/0003/168339/Statement_of_Opportunities_2015_WEB.pdf p8

[3] http://www.dpc.nsw.gov.au/__data/assets/pdf_file/0003/168339/Statement_of_Opportunities_2015_WEB.pdf p8

[4] http://www.bocsar.nsw.gov.au/agdbasev7wr/_assets/bocsar/m716854l11/nswcustodystatisticsdec2014.pdf p22

[5] http://www.dpc.nsw.gov.au/__data/assets/pdf_file/0006/168873/Market_Sounding_-_Reducing_reoffending_and_return_to_custody.pdf p12

[6] Six fallacies of this calculation can be read here http://www.themandarin.com.au/5274-will-publishing-unit-costs-lead-social-investment/

Delivering the Promise of Social Outcomes: The Role of the Performance Analyst

I’ve wanted to write about performance management systems for a long time. I knew there were people drawing insights from data to improve social programs and I wanted to know more about them. I wanted to know all about their work and highlight the importance of these quiet, back-office champions. But they weren’t easy to find, or find time with.

Dan
Dan Miodovnik, Social Finance

I worked at Social Finance in London for three months in late 2013, a fair chunk of that time spent skulking around behind Dan Miodovnik’s desk. I’d peer over his shoulders at his computer screen as he worked flat out, trying to catch a glimpse of these magic performance management ‘systems’ he’d developed. At the end of my time at Social Finance, I understood how valuable the performance management role was to their social impact bonds (SIBs), but I still had no idea of what it actually entailed.

Antonio Miguel, The Social Investment Lab

Then early 2014 Antonio Miguel and I took a 2-hour bullet train ride through Japan while on a SIB speaking tour. On this train journey I asked Antonio to open his computer and show me the performance management systems he’d worked on with Social Finance. Two hours later, I understood the essential components of a performance management system, but I didn’t fully grasp the detail of how these components worked together.

So I proposed to Dan that we join Antonio on the beaches of Cascais in Portugal in August 2014. My cunning research plan was to catch them at their most relaxed and pick their brains over beach time and beers. Around this time I saw a blog written by Jenny North, from Impetus-PEF that mentioned performance management. A call with her confirmed that they were as enthused about performance management as I was. So I drafted a clean, six-step ‘how to’ guide for constructing a performance management system. I hoped that a quick edit from Dan and Antonio, a couple of quotes and I’d be done.

Interviewing Dan and Antonio blew me away. Only when I heard them talk freely about their work did I realise the magic wasn’t in their computer systems, it was in their attitudes. It was their attitude to forming relationships with everyone who needed to use their data. It was their attitude to their role – as the couriers, rather than the policemen, of data.

They told me that there were plenty of ‘how to’ guides for setting up systems like theirs, but that the difficult thing was getting people to read and implement them.

Isaac Castillo, DC Promise Neighbourhood Initiative

They suggested I throw out my draft and interview more people. People who were delivering services and their investors. I didn’t just need to understand the system itself, I needed to understand what it meant for the people who delivered and funded services. I gathered many of these people at San Francisco’s Social Capital Markets (SOCAP) conference and several more from recommendations. One of these recommendations was Isaac Castillo, who works with the DC Promise Neighbourhood Initiative’s collective impact project. He is now managing not only his team of performance analysts, but the service delivery team too. It’s revolutionary, but it makes complete sense.

Interviewing these people has been a most humbling experience. It has revealed to me the extent of their dedication, innovation and intelligence. It has also revealed to me how little I knew, and in turn, how little we, as a sector, know about these people and their work. I am honoured to share their stories with you – please read them at deliveringthepromise.org.


This research is published by The Social Investment Lab (Portugal), Impetus-PEF (UK) and Think Impact (Australia).

logos in row