Changing a Social Impact Bond (SIB) metric mid-flight

Social impact bonds are new, so involve a lot of learning on the job. This learning is less that one SIB ‘works’ and another SIB does not, but more about the iterative adjustments that allow for more effective services, more flexible procurement processes, more alignment of incentives in contracts. One aspect of SIBs that is new for many jurisdictions is long-term contracts. Long-term contracts have many benefits to those delivering and receiving services, but in order to respond to information that comes to light over this time, they must also allow for adjustment and termination.

As its second year draws to a close, investors in Australia’s first social impact bond, the Newpin Social Benefit Bond, have been asked to approve an amendment to its payment metrics, so that they more faithfully reflect success for the children and families it serves.

The reason for this is that the metric rewards investors when children in foster care are restored to their families by the court (“restorations”). When developing the metrics, the breakdown of restorations where children would return to foster care (“reversals”) was discussed, but failed to be written into the contracts. The intention of the metrics is to reward social outcomes with financial return, which means that while restorations should result in payments, reversals should not.

The Newpin Social Benefit Bond has two different payment metrics. One that determines payment from government to the delivery charity, UnitingCare, and a different one metric to determine payment from UnitingCare to Investors.

Newpin SBB payment metrics

The problem with each metric and the amendments proposed to rectify these problems are shown below. For original contracts and a more detailed summary of metrics see the bottom of this page.

What is the problem?

  • Metric 1 NSW Government => UnitingCare: a drafting error was made that did not deduct reversals in the current measurement period, only previous measurement periods. So the government does not make payments for reversals that occurred in the previous financial years, but does make payments for reversals in the most recent financial year.
  • Metric 2 UnitingCare => investors: UnitingCare makes payments based on the cumulative rate of restoration of children to their families. This includes restorations that have been reversed and thus does not faithfully reflect success for families.

In the second year of the SIB, several reversals occurred. So all parties wanted to ensure that these were not paid for in the same way as successful restorations. Government and UnitingCare agreed to amend their metric (Metric 1). An amendment to the investor metric (Metric 2) was also sought to limit payments for unsuccessful restorations. In order to change the metrics, all 60-odd investors had to agree to it. They were also given the option of selling their investment. Using the results to the end of May 2015, the amended metric would return 7.5% interest to investors for the year, while the original contract would return 13.5% interest for the year. If investors did not agree to the amendment UnitingCare would have to pay the inflated interest and continue the service with an imbalance between payments from government and the interest paid to investors. This may have led to UnitingCare exercising their termination rights at the end of year 3. A 10% cap on reversals was proposed in order to limit the ongoing risk to investors and increase the likelihood that they would agree to the amendment.

The proposed amendment

  • Metric 1 NSW Government => UnitingCare: change to not paying for reversals that occur within 12 months of a restoration.
  • Metric 2 UnitingCare => investors: change to not paying for reversals that occur within 12 months of a restoration, but only up to a cap of 10% of restorations. If more than 10% of restorations are reversed, then reversals over this cap are treated as successful restorations for the purpose of calculating the interest paid by UnitingCare to investors.

The amendment still leaves us with an imperfect metric.

  1. If the proportion of reversals is above 10%, UnitingCare will make interest payments to investors (based on the cumulative restoration rate) which will include restorations that have been reversed, even though this does not reflect success for the families involved.
  2. If the proportion of reversals is above 10%, UnitingCare will make a success payment to investors that includes reversals over the cap, but for these reversals, UnitingCare will not receive government outcome payments.
  3. There were no reversals in the first year of the SBB and 28 children were restored from the mothers’ centres. In the second year to May 2015 (not a full year), 20 children were restored from the mothers’ centres, and 7 of these restorations were reversed, some being reversals of restorations from the previous year. The reversals at the mothers’ centres represent 15% of cumulative restorations. Therefore reversals for the second year are above 10% of restorations. If the amendment is agreed and applied retrospectively to year two, UnitingCare will pay investors for restorations that were not maintained, and for which they themselves receive no payments.

What can we learn?

There are several key lessons I draw from this experience. Note that every other stakeholder may have a completely different list!

  1. It’s important to be able to learn as you go and respond to new information, allowing for amendments, dispute and termination on fair terms.
  2. Having different metrics determining payments to the delivery agency and payments from the delivery agency means that there is some misalignment of incentives.
  3. The Newpin SBB has a mix of ‘impact-first’ and ‘finance-first’ investors. The 10% cap was a way of striking a balance between them. While the fiduciary duties of those investing through structures such as self-managed super funds and Private Ancillary Funds do not conflict with them making social/impact investments, some perceived agreeing to a lower rate of return as conflicting with their fiduciary duties as trustees.
  4. When contracting for outcomes, enormous attention has to be paid to thinking through all potential scenarios, however unlikely, to ensure the intended social outcomes are reflected in the legal terms.
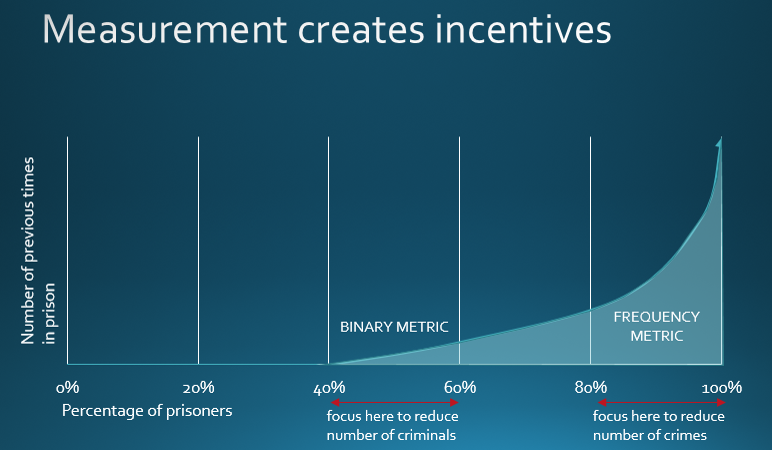
  5. It is very difficult to reflect the journey of someone through social service systems with a binary measure. The definitions and metrics deem the program as either successful or unsuccessful for children and their families, with no ability to accommodate degrees of success or episodes of care over time.

Update on results to July 2015 (2.25 years of service delivery and second payment to investors)

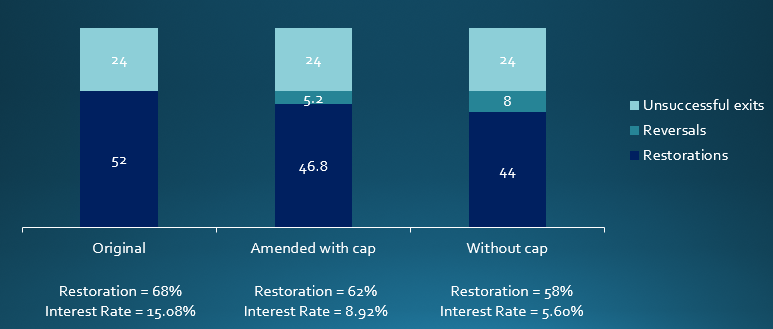
The amendment was passed by all investors. Without the amendment, the Restoration Rate would have been calculated at 68% and the Interest Rate at 15.08%. With the amendment, the Restoration Rate was calculated at 62% and the Interest Rate paid to investors was 8.92%. If there had been no cap, and all reversals were considered unsuccessful outcomes, the Restoration Rate would have been calculated at 58% and the Interest Rate would have been 5.6%. So the investors did agree to forgo much of the interest that was due to them under the original agreement, but gained over 3% more than if all reversals were treated as unsuccessful outcomes. The difference in the investor interest was paid by the charity UnitingCare. The amount they were paid by NSW Government paid was not affected by this.

Newpin SBB metric - year 2

References

Metrics summary

  • Metric 1 NSW Government => UnitingCare: for Cohort 1 Outcome Payment = (the total number of restorations for all Mothers’ Centres and Fathers’ Centres – the counterfactual restorations) x the amount in payments look-up table. The counterfactual restorations are set at 25% for the first three years and then by a live control group. There are also payments that do not depend on outcomes and outcome payments for other cohorts.
  • Metric 2 UnitingCare => investors: Interest Rate = 3% + [0.9 x number of restorations for all Mothers’ Centres/(number of referrals to Mothers’ Centres– 55%)] subject to:
    • if the Restoration Rate is below 55%, the Interest Rate is nil; except
    • a minimum of 5% is applied over the first three years; and
    • a maximum of 15%.

*Note that investor payments relate only to Mothers’ Centres as they were considered lower risk at the time the metric was developed. The discussion above focuses on Mothers’ Centres only.

Disclaimer: Emma is a retail investor in the Newpin Social Benefit Bond. She bought her parcel from a wholesale investor when the restrictions around types of investors expired. She firmly believes that Newpin does wonderful and important work with families.  

Developing a counterfactual for a social impact bond (SIB)

The following was taken from a presentation by Sally Cowling, Director of Research, Innovation and Advocacy for UnitingCare Children, Young People and Families. The presentation was to the Social Impact Measurement Network of Australia (SIMNA) New South Wales chapter on March 11 2015. Sally was discussing the measurement aspects of the Newpin Social Benefit Bond, which is referred to as a social impact bond in this article for an international audience.

The social impact bond (called Social Benefit Bond in New South WaleSally Cowlings) was something very new for us. The Newpin (New Parent and Infant Network) program had been running for a decade supported by our own investment funding, and our staff were deeply committed to it. When our late CEO, Jane Woodruff, appointed me to our SIB team she said my role was to ’make sure this fancy financial thing doesn’t bugger Newpin up’.

One of the important steps in developing a social impact bond is to develop a counterfactual. This estimates what would have happened to the families and children involved in Newpin without the program, the ‘business as usual’ scenario. This was the hardest part of the SIB. The Newpin program works with families to become strong enough for their children to be restored to them from care. But the administrative data didn’t enable us to compare groups of potential Newpin families based on risk profiles to determine a probability of restoration to their families for children in care. We needed to do this to estimate the difference the program could make for families, and to assess the extent to which Newpin would realise government savings.

Experimenting with randomised control trials

NSW Family and Community Services (FACS) were keen to randomly allocate families to Newpin as an efficient means to compare family restoration and preservation outcomes for those who were in our program and those who weren’t. A randomised control trial is generally considered the ‘gold standard’ in the measurement of effect, so that’s where we started.

Child's drawing of a happy kidOne of my key lessons from my Newpin practice colleagues was the importance of their relationships and conversations with government child protection (FACS) staff when determining which families were ready for Newpin and had a genuine probability (much lower than 100%) of restoration. When random allocations were first flagged I thought ‘this will bugger stuff up’.

To the credit of FACS they were willing to run an experiment involving local Newpin Coordinators and their colleagues in child protection services. We created some basic Newpin eligibility criteria and FACS ran a list from their administrative data and randomly selected 40 families (all of whom were de-identified) for both sets of practitioners to consider. A key part of the experiment was for the FACS officer with access to the richer data in case files to add notes. Through these notes and conversations it was quickly clear that a lot of mothers and fathers on the list weren’t ready for Newpin because:

  • One was living in south America
  • A couple had moved interstate
  • One was in prison
  • One had subsequent children who had been placed into care
  • One was co-resident with a violent and abusive partner – a circumstance that needed to be addressed before they could commence Newpin

From memory, somewhere between 15 and 20 percent of our automated would-be-referrals would have been a good fit for the program. It was enlightening to be one of the non-practitioners in the room listening to specialists exchange informed, thoughtful views about who Newpin could have a serious chance at working for. This experiment was a ‘light bulb moment’ for all of us. For both the government and our SIB teams, randomisation was off the table. Not only was the data not fit for that purpose, we all recognised the importance of maintaining professional relationships.

In hindsight, I think the ‘experiment’ was also important to building the trust of our Newpin staff in our negotiating team. They saw an economist and accountant listening to their views and engaging in a process of testing. They saw that we weren’t prepared to trade off the fidelity and integrity of the NewpiChild's drawing of happinessn program to ‘get’ a SIB and that we were thinking ethically through all aspects of the program. We were a team and all members knew where they did and didn’t have expertise.

Ultimately Newpin is about relationships. Not just the relationships between our staff and the families they work with, but the relationship between our staff and government child protection workers.

But we still had the ‘counterfactual problem’! The joint development phase of the SIB – in which we had access to unpublished and de-identified government data under strict confidentiality provisions – convinced me that we didn’t have the administrative data needed to come up with what I had come to call the ‘frigging counterfactual’ (in my head the adjective was a bit sharper!). FACS suggested I come up with a way to ‘solve’ the problem and they would do their best to get me good proxy data. As the deadline was closing in, I remember a teary, pathetic midnight moment willing that US-style admin data had found a home in Australia.

Using historical data from case files

Eventually you have to stop moping and start working. I decided to go back to the last three years of case files for the Newpin program. Foster care research is clear that the best predictor of whether a child in the care system would be restored to their family was duration in care. We profiled all the children we had worked with, their duration in care prior to entry to Newpin and intervention length. FACS provided restoration and reversal rates in a matrix structure and matching allowed us to estimate that if we worked with the same group of families (that is, the same duration of care profiles) under the SIB that we had in the previous 3 years, then the counterfactual (the percentage of children who would be restored without a Newpin intervention) would be 25%.

As we negotiated the Newpin Social Benefit Bond contract with the NSW Government we did need to acknowledge that a SIB issue had never been put to the Australian investment market and we needed to provide some protection for investors. We negotiated a fixed counterfactual of 25% for the first three years of the SIB. That means that the Newpin social impact bond is valued and paid on the restoration rate we can achieve over 25%. Thus far, our guesses have been remarkably accurate. To the government’s immense credit, they are building a live control group that will act as the counterfactual after the first three years. This is very resource intensive but the government was determined to make the pilot process as robust as possible

In terms of practice culture, I can’t emphasise enough the importance of thinking ethically. We had to keep asking ourselves, ‘Does this financial structure create perverse incentives for our practice?’ The matched control group and tightly defined eligibility criteria remove incentives for ‘cherry picking’ (choosing easier cases). The restoration decisions that are central to the effectiveness of the program are made independently by the NSW Children’s Court and we need to be confident that children can remain safely at home. If a restoration breaks down within 12 months our performance payment for that result is returned to the government. For all of us involved in the Newpin Social Benefit Bond project behaving thoughtfully, ethically and protecting the integrity of the Newpin program has been our raison d’etre. That under the bond, the program is achieving better results for a much higher risk of group of families and spawning practice innovation is a source of joy which is true to our social justice ethos.

Fewer criminals or less crime? Frequency v binary measures in criminal justice

The June 2013 interim results released by the Ministry of Justice gave us a chance to examine the relationship between the number of criminals and the number of crimes they commit. The number of criminals is referred to as a binary measure, since offenders can be in only one of two categories: those who reoffend and those who don’t. The number of crimes is referred to as a frequency measure, as it focuses on how many crimes a reoffender commits.

The payments for the Peterborough SIB are based on the frequency measure. Please note that the interim results are not calculated in precisely the same way as the payments for the SIB will be made. [update: the results from the first cohort of the Peterborough SIB were released in August 2014 showing a reduction in offending of 8.4% compared to the matched national comparison group.]

In the period the Peterborough SIB delivered services to the first cohort (9 Sept 2010-1July 2012), the proportion of crimes committed over the six months following each prisoner’s release reduced by 6.9% and the proportion of criminals by 5.8%. In the same period, there was a national increase in continuing criminals of 5.4%, but an even larger increase of 14.5% in the number of crimes they commit. The current burning issue is not that there are more reoffenders, it is that those who reoffend are reoffending more frequently.

Criminals or crime 1Criminals (binary measure) in this instance are defined as the “Proportion of offenders who commit one or more proven reoffences”. A proven reoffence means “proven by conviction at court or a caution either in those 12 months or in a further 6 months”, rather than simply being arrested or charged.

Crime (frequency measure) in this instance is defined as “Any re-conviction event (sentencing occasion) relating to offences committed in the 12 months following release from prison, and resulting in conviction at court either in those 12 months or in a further 6 months (Note: excludes cautions).”

The two measures are related – you would generally expect more criminals to commit more crimes. But the way reoffending results are measured creates incentives for service providers. If our purpose is to reduce crime and really help those who impose the greatest costs on our society and justice system, we would choose a frequency measure of the number of crimes. If our purpose is to help those who might commit one or two more crimes to abstain from committing any at all, then we would choose a binary measure.Criminals or crime 2Source of data: NSW Bureau of Crime Statistics and Research

The effect of the binary measure in practice: Doncaster Prison

A Payment by Results (PbR) pilot was launched in October 2011 at Doncaster Prison to test the impact of a PbR model on reducing reconvictions. The pilot is being delivered by Serco and Catch22 (‘the Alliance’). The impact of the pilot is being assessed using a binary outcome measure, which is the proportion of prison leavers who are convicted of one or more offences in the 12 months following their release. The Alliance chose to withdraw community support for offenders who are reconvicted within the 12 month period post-release as they feel that this does not represent the best use of their resources. Some delivery staff reported frustration that support is withdrawn, undermining the interventions previously undertaken. (Ministry of Justice, Process Evaluation of the HMP Doncaster Payment by Results Pilot: Phase 2 findings.)

I have heard politicians and policy makers argue that the public are more interested in reducing or ‘fixing’ criminals than helping them offend less, and thus the success of our programmes needs to be based on a binary measure. I don’t think it’s that hard to make a case for reducing crime. People can relate to a reduction in aggravated burglaries. Let’s get intentional with the measures we use.