
The Utah SIB recently paid a return for Goldman Sachs, and press releases from both Goldman Sachs and United Way of Salt Lake deemed the program a success. But this was met with some criticism, most notably by the New York Times in Nathaniel Popper’s article Success Metrics Questioned in School Program Funded by Goldman. Now I would argue that success for each stakeholder is achieving whatever they wanted to achieve. So as far as I’m concerned, claiming success simply means that things happened as you wanted. But we might also assume that a government’s objectives are what it’s prepared to pay for via the SIB payment metric.
So how does the payment metric for the Utah SIB work?
For the first year results, Goldman Sachs was paid 95% of the savings to the state. Savings to the state are calculated from the number of children identified as ‘likely to use special education in grade school’[i] (110 in year 1) minus the number of children who used special education (1 in kindergarten) multiplied by the cost of a special education add-on for one year ($2607).
Is that a success?
Well, the program is doing very well at delivering on its payment metric. Of the 110 children identified as likely to use special education, only one of them is using special education in kindergarten. If this is the definition of success, then the program is definitely a success!
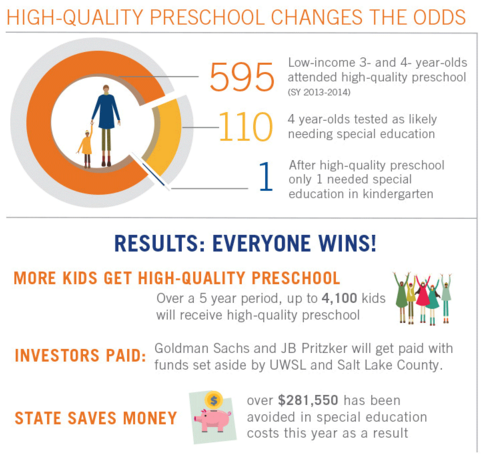
(United Way (2015) SIB fact sheet)
So what’s the problem?
Many people who aren’t involved in the SIB would define success a little differently to the payment metric. They would define the success of the program by the reduction in how many children would require special education support. What we don’t know is how many of the 110 children would have needed special education without the program. I teach my probability classes that ‘likely’ means 50%-80%. But the payment metric seems to assume that 100% of the children would have needed special education without the program, according to the savings-to-government calculation. In order to know how much the program improved things for the children involved, we need a comparison group or ‘counterfactual’, an estimate of how many of the children would have ended up using special education. A counterfactual means you can claim you caused the results, the absence of a counterfactual means you can only say you contributed to them.
What’s a counterfactual?
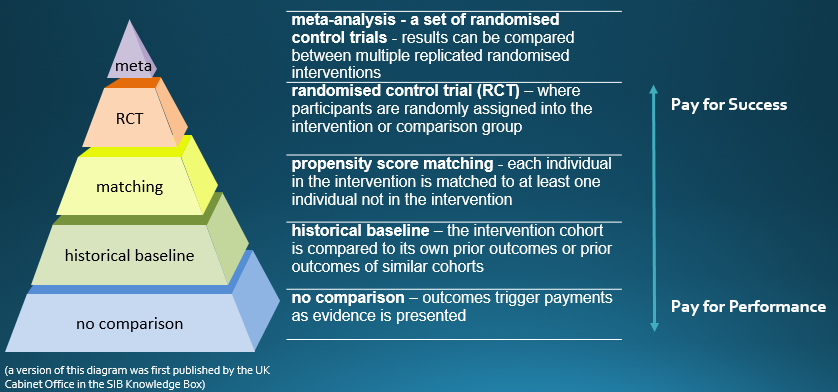
A counterfactual or comparison group can be constructed in several ways. “A good comparison group is as similar as possible to the group of service users who are receiving an intervention, thus allowing you to be confident that the difference in outcomes between the groups is only caused by the intervention.”[ii] Some of the more commonly used counterfactuals in SIBs are shown below.
If you would like to know more, I recommend this Guide to Using Comparison Group Approaches from NPC and Clinks in the UK. And for guidance on randomised control trials in public policy setting you can’t go past the UK Cabinet Office’s Test, Learn, Adapt.
The Utah SIB involved no comparison group – certainly the payment metric didn’t.
So without a counterfactual, what can we say about this SIB?
- “Of the 110 four-year-olds had been previously identified as likely to use special education in grade school…only one went on to use special education services in kindergarten.”[iii]
- “These results triggered the first payment to investors for any SIB in the United States.”[iv]
- “As a result of entering kindergarten better prepared, fewer children are expected to use special education and remedial services in kindergarten through 12th grade, which results in cost savings for school districts, the state of Utah and other government entities.”[v] [note this says ‘fewer children are expected to use’, not ‘fewer children use’]
- “109 of 110 At-Risk Utah Students Avoid Special Education Services Following High-quality Preschool”[vi] [this would be untrue if the word ‘following’ was changed to ‘due to’ or ‘because of’]
- “Utah’s [curriculum and testing] methodology was vetted both locally and nationally by early education and special education experts and leaders”[vii]
- “They lacked certain basic data on what would have been expected to have happened to the students without the Goldman-funded preschool”[viii]
- “My kids have really grown. I don’t think [my kids] would be where they are if it wasn’t for the preschool. That basic step is what prepares you to succeed in school, and later, in life.”[ix]
What can’t we say?
- “School districts and government entities saved $281,550 in a single year, based on a state resource special education add-on of $2,607 per child.”[x][we have no idea what they would have spent on this group otherwise]
- “High-quality preschool changes the odds”[xi][we simply don’t know what the odds would have been without the preschool program, so we can’t say that they’ve changed]
- “Fewer children used special education services and remedial services by attending the SIB-financed Preschool Program, saving money for school districts and government entities”[xii]
What other SIBs don’t have a counterfactual?
- UK: ten DWP Innovation Fund programs (seven of which were SIBs) [the Impetus-PEF ThinkForward SIB press release shows similar difficulty to the Utah SIB in understanding the difference made to young people. While 90% of young people engaged in further education, employment or training seems a wonderful result, there is no estimate of what might have happened otherwise.]
- UK: seven Fair Chance Fund SIBs
- UK: four Youth Engagement Fund SIBs
- UK: Manchester Children in Care
- UK: It’s All About Me – Adoption SIB
- Canada: Saskatchewan single mothers’ SIB
- Australia: Newpin SIB (for the first three years while a control group is established)
Note that most government spending on social services is not compared to a counterfactual. Some people argue that the perceived requirement for a SIB counterfactual creates an unnecessary additional barrier to SIB development, but others argue that it’s the best thing about SIBs – for the first time we are having mainstream discussions about standards of measurement and evidence in social services.
If you know of any government-funded social programs other than SIBs that do have a counterfactual, please post a link to them in the comment box below.
Why doesn’t every SIB have a counterfactual?
- In order to estimate the effect of an intervention with any confidence, you need a large sample size. This is called ‘statistical power’ – I’ve tried to explain it in SIB Knowledge Box: Statistical Power. If a program is working intensively with just a few people, as is the case in Saskatchewan (22 children in SIB), then a reliable comparison to a counterfactual is not possible.
- It is more work to set up a counterfactual – a similar comparison group must be established and this can take varying degrees of effort. It also takes skill that is in short supply. Biostatisticians are one of the the best resources for this kind of work. Most government stats units do not have experience in this kind of work.
- Without a counterfactual, results can be counted as they are achieved, rather than waiting for a statistical comparison for the group, so investors can get paid earlier and more frequently and managers can ‘track’ performance.
As always, if there’s anything in this article that needs correcting or information that should be included, please either comment below or use the contact page to send me an email.
[i] United Way (2015) SIB fact sheet
[ii] NPC & Clinks (2014) Using comparison group approaches to understand impact
[iii] Edmondson, Crim, & Grossman (2015) Pay-For-Success is Working in Utah, Stanford Social Innovation Review
[iv] Edmondson, Crim, & Grossman (2015) Pay-For-Success is Working in Utah, Stanford Social Innovation Review
[v] United Way of Salt Lake 2015, Social Impact Bond for Early Childhood Education Shows Success
[vi] United Way of Salt Lake 2015, Social Impact Bond for Early Childhood Education Shows Success
[vii] Bill Crim, 2015, When Solid Data Leads to Action – Kids’ Lives Improve
[viii] Nathaniel Popper, 2015, Success Metrics Questioned in School Program Funded by Goldman
[ix] United Way (2015) SIB fact sheet
[x] Edmondson, Crim, & Grossman (2015) Pay-For-Success is Working in Utah, Stanford Social Innovation Review
[xi] United Way (2015) SIB fact sheet
[xii] United Way (2015) SIB fact sheet
